Real-Time Estimation of Pedestrian Density in Crowded Urban Environments
230 likes | 345 Vues
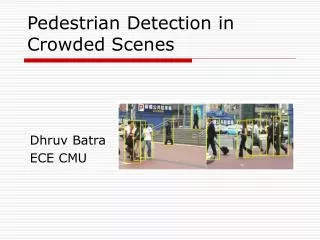
This study presents a method for estimating pedestrian density using existing CCTV infrastructure in urban transportation hubs. Aimed at enhancing public safety and crowd control, the system detects potential congestion in real-time (1-3 seconds) by analyzing camera feeds. It uses background subtraction and pixel labeling to estimate the number of pedestrians without relying on individual identification. Evaluations were conducted at Liverpool Street underground station, demonstrating a high true detection rate, making it suitable for real-time applications in busy environments.

Real-Time Estimation of Pedestrian Density in Crowded Urban Environments
E N D
Presentation Transcript
Estimating Pedestrian Density in Crowded Conditions Sergio A Velastin Boghos Boghossian Jia Hong Yin Lionel Legry Vision & Robotics Lab King’s College London http://www.research.eee.kcl.ac.uk/VRL BMVA Intelligent Surveillance
The Context • Sustainable cities need to make public transport attractive. • Public transport needs to be run efficiently. • Main passenger’s concerns: • Personal security. • Personal safety/comfort. • Safety issue: Congestion. • Crowd control through CCTV, but not enough human viewers. • Aim: Detect potential congestion to alert operators. BMVA Intelligent Surveillance
Requirements • Real-time (within 1-3 secs.) • Use existing CCTV infrastructure. • Detect events before they become uncontrollable. • Typical scenario: • An urban station might have 30-100 cameras. • A control room might have 3-10 TV monitors. • 1/2 of these monitors scan randomly. • only ~10% cameras seen at any given time. • Approach: • Note uneventful cameras. • From the rest, select most eventful. • Show these so operator judges possible actions. BMVA Intelligent Surveillance
Experimental Set-up • Part of EC-funded project “CROMATICA”. • Liverpool St. underground station in London. • Major commuting “hub” (four lines, links with railways, fourth busiest in London). • 72 cameras cover ~80% of the station. • Equipment: • PC (166MHz!) • Monochrome frame-grabber (8 bits, 512x512, 1 camera). • S-VHS Video tape recorder (for post-analysis). • Sometimes: additional processing hardware. Control Room Equipment BMVA Intelligent Surveillance
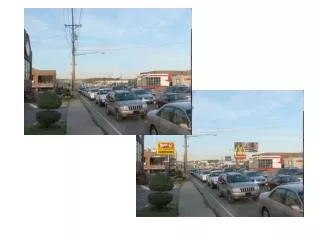
Detection of overcrowding • Based on earlier work (EPSRC 93-95). • Obtain background frame: • Cameras are fixed. • Small changes in ambient lighting. • Either end-user selects a background frame or continuous (slow) adaptation. • Subtract current image from background. • Label remaining pixels (remove small groups of isolated pixels). • There is an approximate relationship between number of people and number of labeled pixels. • Scene calibration: • People vs. pixels. • Perspective correction (from apparent size of nominal people vs. position on ground plane). BMVA Intelligent Surveillance
Image! BMVA Intelligent Surveillance
Methodology • Ground-truth: Manual annotation. • Manual measurement of number of people for each frame too expensive! • Operators don’t count people, but use what is known as “service levels” (discrete set of crowding levels): • “A”: Free normal flow ( 0.6 peds./m2). • “B”: Restricted flow (0.6 - 0.75 peds./m2). • “C”: Dense flow (0.75 - 1.25 peds./m2). • “C2”: Very dense flow (1.25 - 2.0 peds./m2). • “D”: Jammed flow ( 2.0 peds./m2). • Manual samples every 10 seconds (different pedestrians, if moving). • System generates results (estimate of number of people) every 200ms. Average within 10 sec. period. • Compare manual vs. automatic “service levels” BMVA Intelligent Surveillance
Service Levels A B C1 C2 D BMVA Intelligent Surveillance
Sample results • 2 hours of recording • 1% “no” detection (manual > auto) • 6% “false” detection (manual < auto) • 93% “true” detection (manual = auto) • Acceptable to end-users (no detection more critical than false alarms). • Does not use pedestrian identification, so performance affected by occlusion & density non-uniformity. Example over a 15 min interval BMVA Intelligent Surveillance
Stationary overcrowding • Congestion usually implies stationary people. • Can happen (alarm needed) at lower densities. • Similar approach: • Remove background. • Label moving pixels using moving-edge detector. • Correlate number of edges to number of (moving) people. • Estimate number of static people (). • Manual sampling ~ every 10 secs. Note situations higher than service level B. • Compare results. BMVA Intelligent Surveillance
Typical Results • Performance: • Speed: 3 seconds/frame (old transputer!). • True detection (same alarm): 96% (moving), 93% (static). • No detection (manual alarm, no auto alarm): 4% (moving), 7% (static). • False detection (auto alarm, no manual alarm): 7% (moving), 7% (static). • Detection ok. No/False: could be better! BMVA Intelligent Surveillance
Strengths/Limitations • Simple to implement “real-time” is possible. • Difficult to deal with variability, so pedestrian identification has been avoided (c.f. gas theory!). • Reasonable detection performance. • Perspective: “saturation” reached when ~ 70-80% image occupied by people. • Does not deal with occlusion. • “Local” congestion difficult to measure. BMVA Intelligent Surveillance
Texture Approach • Hypothesis: image texture related to occupancy (MA Vicencio-Silva, UCL). • Low occupancy: “flat” texture. • High occupancy: “rich” texture. • Can it distinguish service levels? • Have used two methods: • “Statistical” (Grey Level Dependency Matrix). • “Spectral” (Fourier) BMVA Intelligent Surveillance
Grey Level Dependency Matrix • Define inter-pixel distance d and inter-pixel orientation . • Compute matrix of second-order joint conditional probability of grey levels , given : • Texture “measures” (Haralick) • Contrast • Homogeneity • Energy • Entropy • d = 1, = 0, 45, 90, 135 four matrices, 16 texture vector components. BMVA Intelligent Surveillance
Spectral • Use polar image coordinates (r, ) • Calculate Fourier coefficients for discrete bands of r and . • Texture vector of 24 components. • Then for “Global” occupancy: • Compute a texture vector for the whole image (i.e. single descriptor for the image e.g. “nearly empty”). • Use manual ground truth to train a self organising map (Kohonen). • Use trained network to classify new images into service levels. BMVA Intelligent Surveillance
Results • Results comparable to previous ones. • “Real-time” implementation is possible. % correct detection (Grey level dependency matrix) % correct detection (spectral) BMVA Intelligent Surveillance
Local Occupancy • Manually identify areas for each class in a training set. • Compute GLDMs and texture vector for a random set of pixel neighbourhoods within such areas. • Train the classifier (SOM). • Use the trained classifier to estimate occupancy level for each pixel in unknown images. Smooth results. • Output is a segmented image showing local occupancy in an image. • Can also use frequency distribution of classes in segmented image to compute global occupancy. BMVA Intelligent Surveillance
Examples BMVA Intelligent Surveillance
Motion Estimation • Simple block-matching 8x8, search area: 20 pixels. • Own hardware can process video at full frame rates. • Currently experimenting with MPEG-2 video streams (~standard!). • Use motion to: • Improve estimation of background. • Estimate perspective. • Detect flow in unexpected directions (e.g. in one-way corridors). • Detect unusual stationary image regions (people/objects), e.g. buskers, drug dealers. • Detect intrusion into forbidden areas (e.g. edge of train platforms). BMVA Intelligent Surveillance
Background BMVA Intelligent Surveillance
Stationarity BMVA Intelligent Surveillance
Detection performance • Unusual direction (counter-flow) • True: 99.6%, No: 0.4%, False: 0.8% • Stationary people/objects • True: 98%, No: 2%, False: 0% • Global overcrowding • True: 96%, No: 4%, False: 4% • Congestion (stationary overcrowding) • True: 99%, No: 1%, False: 0.3% BMVA Intelligent Surveillance
Conclusions • Approaches to detect excessive density (congestion) have been developed. • Localisation & tracking of individuals have been avoided (scenes too cluttered). • “Real-time” implementations have been carried out. • Systems tested on-site and with pre-recorded video. • Performance assessed (within 5% confidence, i.e. with significant data sets). • Performance close to end-user expectations. • Next steps: • Integrate to public transport management. • Measure crowd/people behaviour. BMVA Intelligent Surveillance