Download
1 / 60
610 likes | 764 Vues
Estimating Pedestrian Volumes. Robert J. Schneider Safe Transportation Education & Research Center (SafeTREC)—January 2010. Overview. Why are pedestrian volumes important? Alameda County pedestrian counting methods Extrapolating short counts to weeks and years

E N D
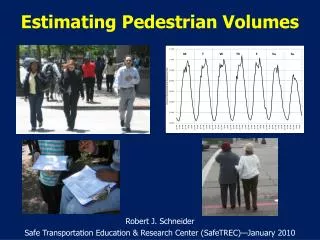
Estimating Pedestrian Volumes Robert J. Schneider Safe Transportation Education & Research Center (SafeTREC)—January 2010
Overview • Why are pedestrian volumes important? • Alameda County pedestrian counting methods • Extrapolating short counts to weeks and years • Estimating volumes from a model
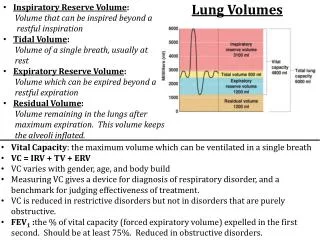
1) Why are Pedestrian Volumes Important? • Track pedestrian volume over time • Quantify exposure to calculate pedestrian crash risk • See where & when pedestrian activity occurs City of Portland, OR
2) Alameda County Pedestrian Counting Methods • Manual Counts • Field data collectors & count sheets • Short time periods • Automated Counts • Sensor technology • Continuous counts
Alameda County, CA 40 miles • Key Partner = ACTIA • Population = 1.46 million • Land area = 738 square miles • Largest City = Oakland (401,000) Oakland Alameda County San Francisco
Example: Broadway & 2nd Street Pedestrian Screenline/Segment Counts Google Earth—Tele Atlas 2008
Example: Broadway & 2nd Street Pedestrian Midblock Crossing Counts Google Earth—Tele Atlas 2008
Example: Broadway & 2nd Street Pedestrian Intersection Crossing Counts Google Earth—Tele Atlas 2008
Example: Broadway & 2nd Street Pedestrian Intersection Crossing Counts Google Earth—Tele Atlas 2008
Example: Broadway & 2nd Street Bicyclist Intersection Turning Counts Straight Left Right Google Earth—Tele Atlas 2008
Manual Count Resource Needs • Site selection (strategic analysis) • $200-$300 per 2-hour pedestrian & bicycle count • Data collector training & management • Travel to site • Count period • Most sites = 1 data collector (except high volume) • Data entry & cleaning (15-20 min. per 2-hour count) • Cost reduction • Use existing count methods and forms • Use interns & volunteers (cautiously!) • Repeat at regular intervals
Automated Counters www.eco-compteur.com
Percent of Weekly Volume by Hour (Composite of 13 Automated Count Sites)
Automated Count Resource Needs • $2,000-$2,500 per EcoCounter Infrared Sensor • Budget time for permission & travel to location • 10-15 min. to install (follow instructions) • 5-10 min. to download data in field (need software) • Data cleaning & analysis • Search data for anomalies • Summarize data in meaningful way • Repeat at regular intervals • Alternatives: Other sensors, video
3) Extrapolating Short Pedestrian Counts • Calculated extrapolation factors from continuous pedestrian counts • Time of day, day of week, season of year • Land use • Weather • Identified “peak” pedestrian activity • Derived from 13 locations in Alameda County
“Typical” Pedestrian Activity Pattern vs. Employment Centers
“Typical” Pedestrian Activity Pattern vs. Employment Centers
“Typical” Pedestrian Activity Pattern vs. Employment Centers
Land Use Adjustment Factors Counts taken at locations with specific types of land uses were multiplied by these factors to match counts taken at “typical” Alameda County Locations
Weather Adjustment Factors Counts taken under certain weather conditions were multiplied by these factors to match counts taken during “typical” Alameda County weather conditions
Seasonal Adjustment Factors Counts taken during the spring were multiplied by these factors to match counts taken in Alameda County during a typical time of the year
Example: Estimate the Annual Pedestrian Volume at an Intersection • Telegraph Ave. & 27th St. (Oakland) • 2-hour pedestrian count (Tue., 5/26, 2-4 p.m.) • 65 degrees, cloudy • Total crossings of all legs = 212
Example: Estimate the Annual Pedestrian Volume at an Intersection • Telegraph Ave. & 27th St. (Oakland) • 2-hour pedestrian count (Tue., 5/26, 2-4 p.m.) • 65 degrees, cloudy • Total crossings of all legs = 212 • Extrapolate to typical week: Multiply by 42.54
Example: Estimate the Annual Pedestrian Volume at an Intersection • Telegraph Ave. & 27th St. (Oakland) • 2-hour pedestrian count (Tue., 5/26, 2-4 p.m.) • 65 degrees, cloudy • Total crossings of all legs = 212 • Extrapolate to typical week: Multiply by 42.54 • Extrapolate to typical year: Multiply by 52.18
Example: Estimate the Annual Pedestrian Volume at an Intersection • Telegraph Ave. & 27th St. (Oakland) • 2-hour pedestrian count (Tue., 5/26, 2-4 p.m.) • 65 degrees, cloudy • Total crossings of all legs = 212 • Extrapolate to typical week: Multiply by 42.54 • Extrapolate to typical year: Multiply by 52.18 • Account for spring count: Multiply by 0.981
Example: Estimate the Annual Pedestrian Volume at an Intersection • Telegraph Ave. & 27th St. (Oakland) • 2-hour pedestrian count (Tue., 5/26, 2-4 p.m.) • 65 degrees, cloudy • Total crossings of all legs = 212 • Extrapolate to typical week: Multiply by 42.54 • Extrapolate to typical year: Multiply by 52.18 • Account for spring count: Multiply by 0.981 • Account for employment & commercial retail land uses: Multiply by 0.97 and by 1.002
Example: Estimate the Annual Pedestrian Volume at an Intersection • Telegraph Ave. & 27th St. (Oakland) • 2-hour pedestrian count (Tue., 5/26, 2-4 p.m.) • 65 degrees, cloudy • Total crossings of all legs = 212 • Extrapolate to typical week: Multiply by 42.54 • Extrapolate to typical year: Multiply by 52.18 • Account for spring count: Multiply by 0.981 • Account for employment & commercial retail land uses: Multiply by 0.97 and by 1.002 • Account for cloudy weather: Multiply by 1.06
Example: Estimate the Annual Pedestrian Volume at an Intersection • Telegraph Ave. & 27th St. (Oakland) • 2-hour pedestrian count (Tue., 5/26, 2-4 p.m.) • 65 degrees, cloudy • Total crossings of all legs = 212 • Extrapolate to typical week: Multiply by 42.54 • Extrapolate to typical year: Multiply by 52.18 • Account for spring count: Multiply by 0.981 • Account for employment & commercial retail land uses: Multiply by 0.97 and by 1.002 • Account for cloudy weather: Multiply by 1.06 • Estimated annual pedestrian crossings ~ 475,000
4) Estimating Pedestrian Volumes from Statistical Models • Developed model from counts at 50 intersections in Alameda County • Identified factors associated with higher vols. • Total population within 0.5 mi • Total employment within 0.25 mi • Number of commercial retail properties within 0.25 mi • Presence of regional rail station within 0.1 mi • Created simple spreadsheet for applying model
Pilot Model Formula Estimated Weekly Pedestrian Crossings = 0.928 * Total population within 0.5-miles of the intersection + 2.19 * Total employment within 0.25-miles of the intersection + 98.4 * Number of commercial properties within 0.25-miles of the intersection +54,600 * Number of regional transit stations within 0.10-miles of the intersection - 4910 (Constant) Adjusted R2=0.897 Independent variables significant at 95% confidence level
Considerations for Applying the Model Designed for estimating volumes at neighborhood, corridor, and community levels. Actual pedestrian counts should be used for site-level safety, design, and engineering analyses.
Thank you • Lindsay Arnold & David Ragland (SafeTREC) • Alameda County Transportation Improvement Authority • California Department of Transportation • Volunteer counters & SafeTREC students
EcoCounter Validation Counts • Prior Studies: • Shawn Turner, et al. (2007), "Testing and Evaluation of Pedestrian Sensors", http://swutc.tamu.edu/publications/technicalreports/167762-1.pdf • Ryan Greene-Roesel, et al. (2008), “Effectiveness of a Commercially Available Automated Pedestrian Counting Device in Urban Environments: Comparison with Manual Counts”, http://www.tsc.berkeley.edu/news/08-0503session240ryanposter.pdf • High and low pedestrian volumes • Different sidewalk widths • Different weather conditions