Download

1 / 43
430 likes | 564 Vues
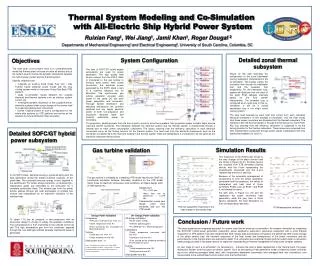
This document presents the simulation model of an electric ship's onboard power system, developed by OPAL-RT Technologies. The model includes two zones for steady-state and transient analyses, demonstrating the system's behavior under normal and faulty conditions. Key elements include induction motor loads, critical and non-critical power loads, and various test scripts for system performance evaluation. Users can employ this model for analyzing fault scenarios and investigating system stability and responsiveness in maritime applications.

E N D
TestDrive DemoElectric Ship Onboard Power System OPAL-RT TECHNOLOGIES Montreal, Quebec, Canada www.OPAL-RT.com EMS Rev. 001, March, 2009
Contents • Model Description • TestDrive Panel Introduction • Test Scripts Model link: onboardPS_ESTS_mdl1v19b_r2008a.mdl (open with Matlab 7.0.1, if open with higher version quit without save)
Model Schematic The Electric Ship Onboard Power System In this 1-target model, only Zone 1 and 2 are modeled. 3
Model Schematic Load Details Hotel load: Non-critical ac load Induction motor (IM) Critical load Constant power load: Non- critical dc load 4
Model Description This model simulate a electric ship onboard power system. Two zones are simulated in a 1-target model and four zones are simulated in a 2-target model. It can be used for system steady state and transient studies. During a fault, the onboard power system is reconfigured to avoid failure of critical loads. 5
Model Description • CPU allocation and Signal exchange media Two zones are simulated in a 1-target model and four zones are simulated in a 2-target model. 6
Model Description Model’s look in Simulink/SPS console Generators @ Zone1 Generators @ Zone2 Load 1 @ Zone1 Load 1 @ Zone2 Load 2 @ Zone1 Load 2 @ Zone2 7
Model Description System Load Induction machine Hotel load Constant power load 8
TestDrive Panel Introduction • Control Panel and System Diagram IM load select Scope select Fault setup AC load break On/Off Const. load ref. set TSB compensation IM control select
TestDrive Panel Introduction IM Measurement Panel IM 3-phase voltages IM 3-phase currents IM active & reactive powers IM Torques (elec. & Mech.), mech. Speed, modulation index 10
TestDrive Panel Introduction Load Measurement Panel Hotel load 3-phase voltages Hotel load 3-phase currents Hotel load P & Q Constant Load Power 11
TestDrive Panel Introduction Bus Measurement Panel Port and starboard bus Voltages dc voltages of Gen1 & collector bus dc currents of Gen1 & collector bus powers of Gen1 & collector bus 12
TestDrive Panel Introduction System Schematic 13
Test Scripts Steady state Steady state IM control Hotel load and Constant load variations Time Stamped Bridge compensation Fault studies Generator bus fault Port bus fault 14
Test Scripts Steady state Steady state IM control Hotel load and Constant load variations Time Stamped Bridge compensation Fault studies Generator bus fault Port bus fault 15
Test Script: Steady State 1.1 Steady state • In Control Panel, keep parameters at default values. Select buses port/starboard and which zone and load to observe the waveforms. Control Panel 16
Test Script: Steady State 1.1 Steady state bus voltages are at 1pu in steady states Bus measurement Panel 17
Test Script: Steady State 1.1 Steady state Hotel load power is 1pu, constant power is 0.5pu as set in the control panel. (The base value of the two powers are on their own ratings) Load measurement Panel 18
Test Script: Steady State 1.1 Steady state IM measurement Panel 19
Test Script: Steady State 1.2 IM control • In Control Panel, select IM load, IM control mode and reference, and perturbation mode and magnitude. Control Panel 20
Test Script: Steady State 1.2 IM control In this test, the IM load ‘torque=omege^2’, control mode=‘speed control’, Speed reference = ‘0.8pu’, perturbation mode =‘Triangle’, perturbation value=‘0.1pu’ are selected. the IM speed tracks to its reference IM measurement Panel 21
Test Script: Steady State 1.2 IM control In this test, the IM load ‘torque=omege^2’, control mode=‘speed control’, Speed reference = ‘0.8pu’, perturbation mode =‘Triangle’, perturbation value=‘0.1pu’ are selected. Bus measurement Panel 22
Test Script: Steady State 1.3 Hotel load and Constant load variations • In Control Panel, select to switch On/Off of one branch of Hotel load. • Set the constant load power reference. Control Panel 23
Test Script: Steady State 1.3 Hotel load and Constant load variations In this test, ‘ac_load_break’ = ‘Off’, ‘const_ld_ref’=1.5pu the Hotel load current and power reduced to 0.2 pu (the load of 0.8 pu is switched off) the constant power load consumes a power of 1.5 pu, same as the reference Load measurement Panel 24
Test Script: Steady State 1.4 Time Stamped Bridge compensation • In Control Panel, switch the ‘TSB compensation’ ON/OFF to see its effects on the waveforms. Control Panel 25
Test Script: HVAC Fault 1.4 Time Stamped Bridge compensation • To have a close view of waveforms, show acquisition group 1, set frame size = 50 ms. Show acquisition Group 1, set frame Size = 50 ms 26
Test Script: Steady State 1.4 Time Stamped Bridge compensation Vdc has ±1% variations Vdc has ±0.5% variations Without RTE compensation With RTE compensation bus measurement Panel 27
Test Script: Steady State 1.4 Time Stamped Bridge compensation IM Voltages has more distortion IM currents has more distortion IM elec. torque has larger ripples Without RTE compensation With RTE compensation IM measurement Panel 28
Test Script: Steady State 1.4 Time Stamped Bridge compensation Hotel load Voltages has more distortion Hotel load currents has more distortion Power of constant power load has larger ripples (±50% vs. ±7% ) Without RTE compensation With RTE compensation IM measurement Panel 29
Test Scripts Steady state Steady state IM control Hotel load and Constant load variations Time Stamped Bridge compensation Fault studies Generator bus fault Port bus fault 30
Test Script: Fault Studies 2.1 Generator bus fault at Zone 1 • In Control Panel, select the fault being ‘permanent’ or ‘periodical’, set fault = ‘Generator bus’. Control Panel 31
Test Script: Fault Studies Gen1 and collector bus voltages drop to zero during the fault. 2.1 Generator bus fault The system reconfigure its connection by switching off the fault generation group and keeps port and starboard bus Voltages 1 pu As fault cleared, Gen1 and collector bus voltages rising up. Generator is re-connected 0.1s after the fault is cleared. Vdc drops to 0.8 pu because Vdc_gen has not recovered to 1pu at that moment. measurements @ Zone 1 Bus measurement Panel 32
Test Script: Fault Studies 2.1 Generator bus fault at Zone 1 In the control panel, select ‘scope selection’ to ‘zone 2 load 1’. Port and starboard bus voltages in Zone 2 have same profile as in Zone 1 Generator group in Zone 2 is affected. Adjusting the generator reconnection policy (e.g. delay time) can avoid voltage drop on port and starboard buses. measurements @ Zone 2 Bus measurement Panel 33
Test Script: Fault Studies 2.1 Generator bus fault at Zone 1 The fault has little effects on the hotel load and constant power load. The visible effects is due to dc voltage drop when the generator group is re-connected measurements @ Zone 1 Load measurement Panel 34
Test Script: Fault Studies 2.1 Generator bus fault at Zone 1 The visible effects is due to dc voltage drop when the generator group is re-connected measurements @ Zone 1 IM measurement Panel 35
Test Script: Fault Studies 2.2 Port bus fault at Zone 1 • In Control Panel, select the fault being ‘permanent’ or ‘periodical’, set fault = ‘Port bus’. Control Panel 36
Test Script: Fault Studies Port bus Voltage drop to zero during the fault. 2.2 Port bus fault at Zone 1 Starboard bus voltage remains 1 pu The system reconfigure its connection to isolate the port bus of Zone 1. Voltages of port bus at other zones, and generator bus at Zone 1 stay around 1 pu. Port bus at Zone 1 reconnects to adjacent zones 0.05s after fault cleared. Generators reconnect 0.1s after the fault cleared. measurements @ Zone 1 Bus measurement Panel 37
Test Script: Fault Studies 2.2 Port bus fault at Zone 1 In Control Panel, select ‘port bus’ and loads in Zone 1. All the non-critical loads connected to port bus fail during fault Zone 1 Port Bus load measurement Panel 38
Test Script: Fault Studies 2.2 Port bus fault at Zone 1 In Control Panel, select ‘port bus’ and loads in Zone 1. IM, as a critical load, works normally due to its redundant power supply: it is connected to both port and starboard buses. Zone 1 Port Bus IM measurement Panel 39
Test Script: Fault Studies 2.2 Port bus fault at Zone 1 In Control Panel, select ‘starboard bus’ and loads in Zone 1. All the non-critical loads connected to starboard bus work normally during fault Zone 1 Starboard Bus Load measurement Panel 40
Test Script: Fault Studies 2.2 Port bus fault at Zone 1 In Control Panel, select ‘port bus’ and loads in Zone 2. Port bus at Zone 2 remains 1 pu since during the fault it is disconnected from Zone 1 There is oscillations when reconnection. It can be improved by system design (i.e. a reactor between adjacent zones). measurements @ Zone 2 Bus measurement Panel 41
Test Script: Fault Studies 2.2 Port bus fault at Zone 1 In Control Panel, select ‘port bus’ and loads in Zone 2. All the non-critical load connected to port bus at Zone 2 only has little effects during reconnection after the fault is cleared. Zone 2 Port Bus load measurement Panel 42
Thanks End of Electric Ship Onboard Power System Demo. Questions and comments? 43