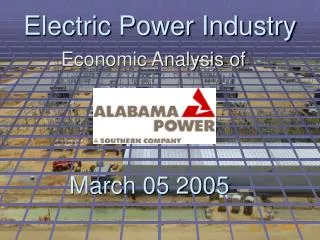
Electric Power Industry
Economic Analysis of . Electric Power Industry. March 05 2005. Team Victory . Brendan Flahive David Monroe Guru Prakash Thapathi John Blackwelder Magda Ramos Victor McCree. How Does This Industry Affect You?. New York’s Power blackout in 2003 estimated cost: $500M

Electric Power Industry
E N D
Presentation Transcript
Economic Analysis of Electric Power Industry March 05 2005
Team Victory • Brendan Flahive • David Monroe • Guru Prakash Thapathi • John Blackwelder • Magda Ramos • Victor McCree
How Does This Industry Affect You? New York’s Power blackout in 2003 estimated cost: $500M CBSBlackout.m3u
Objectives • Introduction - Alabama Power • Electric Power Industry Analysis • Alabama Power Analysis • Forecasts, Projections and Recommendations • Economic Environment • Macro Impact - Alabama Power and Electric Power Industry
What is Alabama Power? David Monroe
Objectives • Alabama Power • Georgia Power • Gulf Power • Mississippi Power • Savannah Electric • Southern Company GAS • Southern Nuclear • Southern Power
Alabama Power • Founded in 1906 • Subsidiary of Southern Company • 78,000 miles of power lines • Customers throughout 44,500 square miles • Uses coal, hydro, natural gas and nuclear sources • 81 electric generating plants located at 24 facilities in Alabama
Electric Power Industry Analysis Victor McCree
Description of Industry • Traditional Electric Utilities, Power Marketers and Non-Utility Power Producers • Federal, Local and State Regulators
Description of Industry • Fossil, Nuclear and Renewable Generators
Market Structure • Monopolistically Competitive • -Local Monopolies • -None Control Major Portion of Market
Market Structure (continued) • Degree of Integration • -Less Regulated/More Competition • Barriers to Entry • -Large Capital Costs • -Fuel Costs • -Competition
Size of Electric Power Industry Relative to Economy • Accounted for Approximately 4% of GDP in 2002 • -Importance to Economy • -One of the Largest Sectors in the U.S. • Surpasses Telecommunications, Airline and Gas Industry
Demand Factors • Weather – Biggest Factor Affecting Sales (Demand) and Supply • Economy – Affects the Demand and Supply for Industrial Customers • Alternative Energy Sources – Influences Demand and Sales Growth • Emissions – Ozone and NOx Restrictions Limits Construction and Operation
Production and Cost Issues • Environmental – Big Cost Influencer for Utilities that Use Mostly Coal-based Generators (like Southern Company) • Fuel Costs – Fossil Costs Tripled in Past 2 Years • Coal and Coke Supply Shortages • Sudden Rise in Costs of Natural Gas • Nuclear • Low Fuel (Uranium) Costs/Competitive Operating Costs • Improved Plant Safety and Reliability
Production and Cost Issues (continued) • New Generating Plants • Aging of Existing Plants • Population Growth
Non-Economic Factors • Alternative Sources • New Technologies • Deregulated Markets
Firm Analysis Brendan Flahive
Demand Factors • Favorable weather conditions: warmer summers and colder winters • Strength of business and economic conditions in service area, i.e. auto industry growth • Price Elasticity of Demand
Energy conservation practiced by customers • New energy contracts with neighboring utilities • Competition Demand Factors (continued)
Production and Cost Issues • Fuel costs were 36% of 2003 total expenses • Purchased Power costs from affiliates and non-affiliates totaled 11%
Production and Cost Issues (continued) • Inflation creates economic loss due to the recovery of historical investment costs that have less purchasing power • Plant maintenance and operations • -LTSAs with GE • Environmental compliance
Market Power • Size and location • Diversified customer base (<10% same) • - 80% retail and 20% wholesale • Alabama PSC sets retail prices • Highly Reliable Service Provider • - 99.97% service availability in 2003
Top 5 Alabama Utilities Ranked by Retail Sales in 2002 • Alabama Power 52,073,190 • Tennessee Valley Authority 5,073,906 • City of Huntsville 4,729,117 • Decatur Utilities 1,440,271 • City of Florence 1,168,312 Note: Figures are in kilowatt-hours (millions) • ALABAMA POWER provides 62.7% of • all the electricity in the state of Alabama!
Who are Alabama Power’s customers? • Retail • Industrial 21,593,000 • Residential 16,960,000 • Commercial 13,452,000 • Other Retail 203,000 • Wholesale • Non-affiliates 17,086,000 • Affiliates 9,422,000 • Note: 2003 sales in kilowatt-hours (millions)
Strategies • Maintain residential pricing at 15% below the national average • Economic and Community Development • Build new plants to reduce purchased power costs • Brand Marketing via Alabama Power Foundation
Goals • Grow earnings per share 5% per year • Environmental compliance and customer satisfaction industry leader • Maintain a stable regulatory environment • Contain costs while growing energy sales and recover costs related to growing demand and environmental standards
Forecasts, Projections and Recommendations Magda Ramos
Electricity Demand Forecast Industrial sector will experience the highest demand increase rates
Electricity by Fuel Forecast Supply of coal and natural gas based electricity will experience the fastest growth due to government incentives
Alabama’s Price Regulation Status Alabama currently regulates market prices and a change in this policy is not foreseeable in the near future
Limited Profit Growth Recommendations for Alabama Power (due to regulation) Reduce production costs Attract more strategic customers to the region Focus marketing and infrastructure strategies on high growth potential customers Value-added product development
Alabama Power Business Outlook Data Profile • Actively working with the Alabama Chamber of Commerce to attract large corporations • Transmission grid ownership allows revenue from ancillary services
Alabama Power Business Outlook Data Profile • 2004 industrial sales rebounded 5.8% due to growth in metal, chemical and paper sectors • Retail sales are projected to grow about 1.7% on average during 2005 through 2009
Economic Environment John Blackwelder
Real GDP Percent Change from Preceding Year Source: Bureau of Economic Analysis
National Employment Level Not Seasonally Adjusted (in thousands)
National Unemployment LevelNot Seasonally Adjusted (in thousands)
Projection of the Total Population of Alabama 1995-2025
Alabama Employment Level Not Seasonally Adjusted All Employees
Alabama Unemployment Level Not Seasonally Adjusted 16 years and over
National Electrical Power Generation Employment Level Not Seasonally AdjustedAll Employees
Alabama Electric Power Generation, Transmission and Distribution Employment Level Not Seasonally Adjusted
Interest Rate Averages 1996 – 2004 (Not Seasonally Adjusted)
PPI Electricity 1996 – 2004 (Not Seasonally Adjusted)
PPI Finished Energy Goods 2000 – 2004 (Not Seasonally Adjusted)