Satellite-based Sensors
430 likes | 644 Vues
Satellite-based Sensors. Chapter 7. Low Spatial-Resolution. Mostly geostationary satellites used for meteorology GOES Also those that gather complete earth image over 1 or 2 days AVHRR, MODIS, SeaWiFS.

Satellite-based Sensors
E N D
Presentation Transcript
Satellite-based Sensors Chapter 7
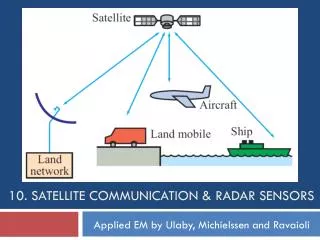
Low Spatial-Resolution • Mostly geostationary satellites used for meteorology • GOES • Also those that gather complete earth image over 1 or 2 days • AVHRR, MODIS, SeaWiFS
satellites placed in geosynchronous orbit afforded nearly instantaneous coverage of near-hemispheres of the Earth • rapidly update views of cloud decks and circulation patterns over almost any part of the world. • Ironically, the very thing that compromises observations of the land and open ocean, namely clouds, is the prime target of meteorological satellites (Metsats). • As more versatile sensors evolved, they quantitatively monitored various other atmospheric or oceanographic properties, such as the stratosphere, tropospheric temperatures, Earth radiation budget, air chemistry (e.g., ozone, CO2, sulphur compounds, and aerosols), wind and sea current movements, sea-ice, and marine biotic nutrients.
Sun-synchronous • Defense Meteorological Satellite Program (DMSP) • Primarily for weather and navigation conditions • 0.4-1.10 μm and 8-13 μm bands • 3,000 km swath • Used for night-lights
The viewing angle of the sensors can be adjusted to look to either side of the satellite's vertical (nadir) track, allowing off-nadir viewing which increases the satellite's revisit capability. This ability to point the sensors up to 27° from nadir, allows SPOT to view within a 950 km swath and to revisit any location several times per week. By pointing both HRV sensors to cover adjacent ground swaths at nadir, a swath of 117 km (3 km overlap between the two swaths) can be imaged.
Five sensors on Terra are: • CERES - Clouds and the Earth's Radiant Energy System • MOPITT - Measurements of Pollution in the Troposphere (Canada) • MISR - Multi-angle Imaging Spectroradiometer • ASTER - Advanced Spaceborne Thermal Emission and Reflection Radiometer (Japan)
Part of a MODIS image set that includes the Mississippi Delta and the Gulf of Mexico
MODIS data allow calculation of the "NDVI" parameter (Normalized Difference Vegetation Index, obtained by dividing a Near IR minus Red radiance by a Near IR + Red value) and sea surface temperatures, as displayed here.
Other wavelengths on MODIS aid in picking up the atmospheric appearance of aerosols, much being the result of pollution.
MODIS can pick out water vapor, even when heavy clouds are absent or dispersed, as shown in this image.
MODIS can also use its short wavelength bands to measure the fluorescent properties of the ocean, which relate to plankton content. Light not used in photosynthesis is re-emitted as fluorescence and heat, so that higher levels of fluorescence indicate lower photosynthetic activity. This is evidenced in this image (red is highest amount) that includes Africa, Saudi Arabia, Iran, India and Pakistan, and parts of the Indian Ocean and the Bay of Bengal:
Other MODIS wavebands in the visible are suited to picking out chlorophyll content (similar approach as SeaWIFS), with reds being high and blues low concentrations.
The versatile MODIS also has thermal bands (for surface temperatures from 3.6 to 4.1 µm). The image below shows the entire Iberian Peninsula (Spain and Portugal) during one of the hottest heat waves ever recorded in that region. On July 1, 2004, one locality reached a ground (not air) temperature of 59°C (138°F). The only cool area in the scene are the Pyrennees Mountain chain dividing Spain from France (in greenish-blue).
MISR To illustrate the benefit of looking simultaneously at an area from multiple angles, consider these four views of part of the Appalachians; because of the more oblique look angle the image farthest to the right shows an aerosol haze that is absent from the nadir and close-in images.
MISR is well-adapted to determining the extent of drought conditions by measuring over time the albedo changes of vegetation. To the left are two MISR natural color images of the Black Hills and surrounding plains that are largely grass covered. The rise in albedo from 2000 to 2004 indicates higher reflectance in these lands as vegetation is diminished and turns into more reflective brown shades:
Ocean Color • CZCS • SeaWiFS • ATSR and AATSR • Along-track scanning radiometer, and advanced • MERIS – MEdium Resolution Imaging Spectrometer • IRS-P4 – has Ocean Color Monitor and Multifrequency Scanning Microwave Radiometer • Terra and Aqua carry MODIS Moderate Resolution Imaging Spectrometer
Medium Spatial Scale • Medium scale roughly means 5-250 m GSD • Beginning with Landsat 1 in 1972 • SPOT • IKONOS • IRS-1C – have LISS-III Linear Imaging Self-Scanning sensor and a WiFS Wide Field Sensor • JERS • ADEOS
High Spatial Resolution • Befroe 1999 only military had < 1m resolution • IKONOS • Quickbird • EROS-A1 • OrbView-3 • 10 x 10 km image about $2,500 - uncorrected
Suitability • A number of factors need to be considered • Spatial resolution • Interpretability – atmospheric problems • Availability and alternative imagery • Availability of equipment and personnel to analyze • Time frame • Level of geometric accuracy • Mapping vs feature ID • Scale required