Concept of Cost Estimation
430 likes | 1.53k Vues
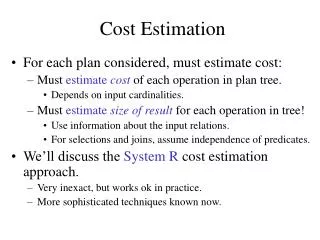
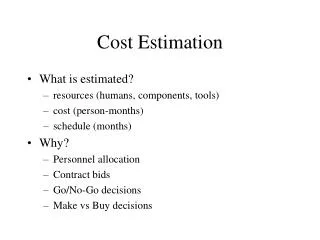
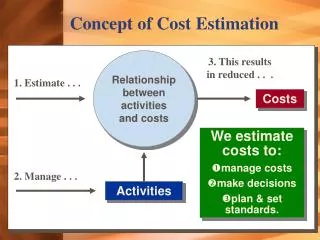
3. This results in reduced . . . 1. Estimate . . . 2. Manage . . . Concept of Cost Estimation. Relationship between activities and costs. Costs. We estimate costs to: manage costs make decisions plan & set standards. Activities. One Cost Driver and Fixed/Variable Cost Behavior.

Concept of Cost Estimation
E N D
Presentation Transcript
3. This results in reduced . . . 1. Estimate . . . 2. Manage . . . Concept of Cost Estimation Relationship between activities and costs Costs • We estimate costs to: • manage costs • make decisions • plan & set standards. Activities
One Cost Driver and Fixed/Variable Cost Behavior This model ignores other cost behaviors and other cost drivers.
One Cost Driver and Fixed/Variable Cost Behavior Slope = Cost Driver Rate $.16 Intercept = Fixed Cost
Multiple Cost Drivers and Complex Cost Behavior In cases of complex cost behavior and multiple cost drivers, the cost-benefit test should be considered when developing a cost estimation model.
Multiple Cost Drivers and Complex Cost Behavior • Step Cost • A cost that increases in steps as the amount of the cost driver volume increases. • Also called a “semifixed cost” Costs stay fixed over a small range of activity called the “relevant range”. As activity increases to the next “relevant range,” costs step up to the next level.
Multiple Cost Drivers and Complex Cost Behavior 1 person can make 50 deliveries per day. Anything more than 50 requires an additional delivery person. Relevant Range
Semivariable Costs A semivariable cost is one that has both a fixed and a variable component. For example, a cellular phone plan that charges $40 for the first 60 minutes and a per minute charge thereafter.
Nonlinear Costs A nonlinear cost is one that has a curved component. For example, the cost of an item may get increasingly cheaper as the quantity purchased increases.
Learning Curve A learning curve relates cost behavior to the time it takes to learn a job. For example, the greater the experience, the less labor hours are required to complete the job.
Learning Curve As evidenced by the learning curve, the “learning phenomenon” tends to disappear over time. i.e. more learning occurs at the beginning than at the end.
Independent variables are the cost drivers that are correlated with the dependent variables. Dependent variables are caused by the independent variables. Cost Estimation MethodsRegression Analysis A statistical method used to create an equation relating independent (or X) variables to dependent (or Y) variables. Past data is used to estimate relationships between costs and activities.
Cost Estimation MethodsRegression Analysis The simple cost model is actually a regression model: TC = F + VX Caution: Before doing the analysis, take time to determine if a logical relationship between the variables exists. This model will only be useful within a relevant range of activity.
Cost Estimation MethodsRegression Analysis • A set of data can be regressed using several techniques: • Manual computations • SPSS or SAS Statistical Software • Excel or other spreadsheet Each regression model has an R-square (R2) measure of how good the model is. Range of R2 = 0 to 1.0 The result of the regression process is a regression model: TC = F + VX
Simple Regression AnalysisExample CC Catering wants to know its average fixed cost and variable cost per unit. Using the data to the right, let’s see how to do a regression using Excel.
Simple Regression AnalysisExample • You will need three pieces of information from your regression analysis: • Estimated Variable Cost per Unit (line slope) • Estimated Fixed Costs (line intercept) • Goodness of fit, or R2 To get these three pieces of information we will need to use THREE different excel functions. LINEST, INTERCEPT, & RSQ
Simple Regression Using Excel 2000 First, open the excel file with your data and click on “Insert” and “Function”
Simple Regression Using Excel 2000 When the function box opens, click on “Statistical”, then on “LINEST”
Simple Regression Using Excel 2000 By clicking on the buttons to the left, you can highlight the desired cells directly from the spreadsheet. 1. Enter the cell range for the cost amounts in the “Known_y’s” box. 2. Enter the cell range for the quantity amounts in the “Known_x’s” box.
Simple Regression Using Excel 2000 The Slope, or estimated variable cost per unit, is identified here. Click OK to put this value on your spreadsheet.
Simple Regression Using Excel 2000 Repeat the procedure using “Intercept”, to estimate fixed cost.
Simple Regression Using Excel 2000 As previously, enter the appropriate cell ranges in their appropriate places. The estimated fixed cost per unit is identified here.
Simple Regression Using Excel 2000 Finally, determine the “goodness of fit”, or R2, by using the RSQ function.
Simple Regression Using Excel 2000 As previously, enter the appropriate cell ranges in their appropriate places. The estimated R2 for your estimated cost function is identified here.
Cost Estimation MethodsMultiple Regression Analysis Multiple Regression is a regression that has more than one independent (X) variable. Want an example? For example, demand for a product may be affected by things such as inflation, interest rates, and competitors’ prices. Can be very useful in situations where the dependent variable is impacted by several different independent variables.
Cost Estimation MethodsAccount Analysis A method that looks at past costs to estimate current cost-driver rates. • Break costs into categories corresponding to each cost driver. • Sum total costs for each cost driver category. • Divide total cost for a given cost driver category by cost driver volume. More expensive than regression, and requires more detailed breakdown of costs.
Cost Estimation MethodsData Problems Mismatched Time Periods Missing Data Outliers Allocated Costs Inflation
Not based on past costs. Cost Estimation MethodsEngineering Method Cost estimates based on measurement and pricing of the work involved in the activities that go into a product.
Choosing an Estimation MethodThings to Consider Regression and account analysis rely on past data. Engineering relies on present data. Each method will likely yield a different estimate. Cost/Benefit must be considered in choosing a method.
Choice of Estimation Method Economic Plausibility Significance of Independent Variables Goodness of Fit