Download
1 / 37
370 likes | 639 Vues
Environmental Pollution and Waste: Air, Water, and Land Media. Environmental Sustainability Educational Resources prepared by Gregory A. Keoleian Associate Research Scientist, School of Natural Resources and Environment Co-Director , Center for Sustainable Systems University of Michigan.

E N D
Environmental Pollution and Waste: Air, Water, and Land Media Environmental Sustainability Educational Resources prepared by Gregory A. Keoleian Associate Research Scientist, School of Natural Resources and Environment Co-Director, Center for Sustainable Systems University of Michigan
Contents • Air Pollution Impacts [slide 4] • Sources of Air Toxics [slide 5-6] • Criteria Air Pollutants [slide 7-9] • Trends in National Emissions of Criteria Pollutants [slide 10] • Comparison of 1970 and 1999 Emissions [slide 11-12] • Comparison of Growth in Population, VMT, GNP with Emissions [slide 13] • Percent Change in Air Quality [slide 14] • Number of People Living in Nonattainment Areas[slide 15]
Trends in Sulfur Dioxide Emissions [slides 16] • Water Pollution [slides 17- 18] • Sources of Point and Nonpoint Source Pollution [slide 19-22] • Water Quality of Assessed Rivers, Lakes and Estuaries [slide 23] • Pollutants and Sources Causing Impairments of Assessed Rivers, Lakes and Estuaries [slide 24] • Toxic Release Inventory [slide 25-28] • TRI data [slides 29-31] • Industrial Waste [slides 32-33] • Municipal Solid Waste [slide 34-35] • Additional Resources [slide 36-37]
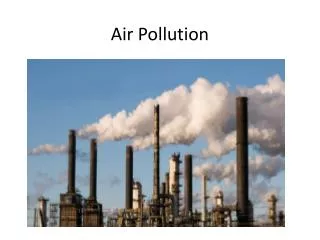
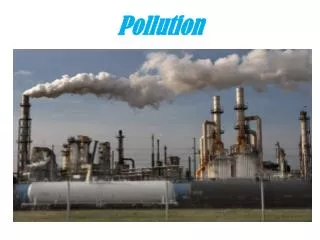
Air pollutant impacts • Greenhouse effect • Ozone depletion • acidification • smog formation • eutrophication • human health • ecosystem health
Criteria Air Pollutants • EPA uses six "criteria pollutants" as indicators of air quality • EPA established for each of them a maximum concentration above which adverse effects on human health may occur.
Criteria air pollutants • Nitrogen Dioxide: NO2 • brownish gas irritates the respiratory system originates from combustion (N2 in air is oxidized); NOx sum of NO, NO2, other oxides of N • Ozone: ground level O3 • primary constituent of urban smog • reaction of VOC + NOx in presence of heat +sun light • Carbon monoxide: CO • reduces bloods ability to carry O2 • product of incomplete combustion
Lead: Pb • cause learning disabilities in children , toxic to liver, kidney, blood forming organs • tetraethyl lead – anti knock agent in gasoline • leaded gasoline has been phased out • Particulate Matter: PM10 (PM 2.5) • respiratory disorders • Sulfur Dioxide: SO2 • formed when fuel (coal, oil) containing S is burned and metal smelting • precursor to acid rain along with NOx
Number of People Living in Counties withAir Quality Concentrations Above the Levelof the NAAQS in 1999
Trends in Sulfur Dioxide Emissions Following Implementation of Phase I of the Acid Rain Program: Total State-level Utility SO2 (1980, 1990, 1999)
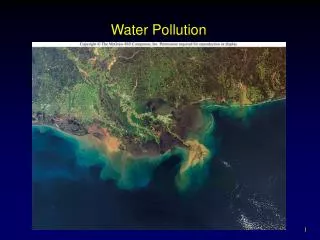
Water Pollution • Based on current water quality standards, over 70 percent of our rivers, 68 percent of our estuaries and 60 percent of our lakes now meet legislatively mandated goals. • Some of the risks include • pollutant runoff from agricultural lands • stormwater flows from cities • About 40,000 times each year, sanitary sewers overflow and release raw sewage to streets and waterbodies.
Water Pollution • seepage into ground water from nonpoint sources • the loss of habitats such as wetlands. • we cannot always eat what we catch because fish flesh is contaminated by the remaining discharges and sources of toxic substances. • Microbial contamination of drinking water still presents problems in many communities.
Pollution Sources • Point sources are direct discharges to a single point; • examples include discharges from sewage treatment plants, injection wells,and some industrial sources.
Pollution Sources • Non-point sources are diffused across a broad area and their contamination cannot be traced to a single discharge point. • Examples include runoff of excess fertilizers, herbicides, and insecticides from agricultural lands and residential areas; oil, grease, and toxic chemicals from urban runoff and energy production; and sediment from improperly managed construction sites, crop and forest lands, and eroding stream banks.
US EPA Toxic Release Inventory • Certain industrial facilities are mandated to annually report to US EPA specified toxic chemicals • mandated under Emergency Planning & Community Right-to-Know Act (EPCRA) in 1986 and enacted under Superfund Amendments & Reauthorization Act in 1987 • response to Bhopal (1984) and other accidents
Who reports • Specified SIC (Standard Industrial Classification) codes, • Have 10 or more equivalent full-time employees, and • Exceed established thresholds for any chemical on the TRI list • 25,000 lb/yr if chemical is manufactured and/or processed • 10,000 lb/yr if chemical is otherwise used
Limitations of TRI 1) TRI does not cover all toxic chemicals that have the potential to adversely affect human health or the environment. 2) TRI does not require reporting from many major sources of pollution releases. 3) TRI does not require companies to report the quantities of toxic chemicals used or the amounts that remain in products. 4) TRI does not provide information about the exposures people may experience as a consequence of chemical use.
1998 TRI Data • On-site releases • 6.9 billion pounds • Off-site releases • 0.4 billion pounds • Transfers off-site for further waste management • 3.0 billion pounds • Total TRI chemicals in waste • 30.5 billion pounds
Industrial Waste • Industrial waste is process waste associated with manufacturing. • This waste usually is not classified as either municipal waste or hazardous waste by federal or state laws. • Regulatory programs for managing industrial waste vary widely among state, tribal, and some local governments. • Each year, industrial facilities generate and manage 7.6 billion tons of nonhazardous industrial waste in land application units.
Municipal Solid Waste • EPA definition • includes wastes such as durable goods, nondurable goods, containers and packaging, food scraps, yard trimmings, and miscellaneous inorganic wastes from residential, commercial, institutional, and industrial sources. • Examples of waste from these categories include appliances, automobile tires, newspapers, clothing, boxes, disposable tableware, office and classroom paper, wood pallets, and cafeteria wastes.
Additional Resources • Air pollution • US EPA • http://www.epa.gov/oar/oaqps/ • http://www.epa.gov/air/ • Water pollution • US EPA • http://www.epa.gov/water/
Toxics Release Inventory • US EPA • http://www.epa.gov/tri/ • Solid waste • US EPA • http://www.epa.gov/solidwaste/