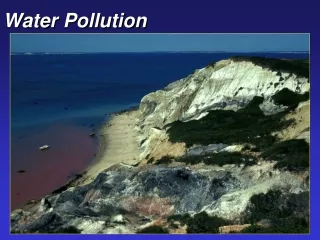
Water Pollution
Water Pollution Asim Zia Introduction to Environmental Issues EnvS 001, Spring 2007 Department of Environmental Studies San Jose State University Chapter 21 Overview Questions What pollutes water, where do these pollutants come from, and what effects do they have?


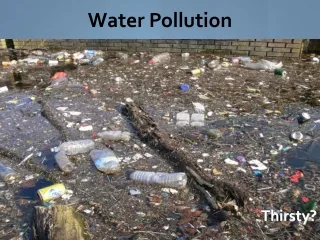
Water Pollution
E N D
Presentation Transcript
Water Pollution Asim Zia Introduction to Environmental Issues EnvS 001, Spring 2007 Department of Environmental Studies San Jose State University
Chapter 21 Overview Questions • What pollutes water, where do these pollutants come from, and what effects do they have? • What are the major water pollution problems in streams and lakes? • What causes groundwater pollution, and how can it be prevented? • What are the major water pollution problems affecting oceans?
Chapter Overview Questions (cont’d) • How can we prevent and reduce surface water pollution? • How safe is drinking water, and how can it be made safer?
Core Case Study: Using Nature to Purify Sewage • Ecological wastewater purification by a living machine. • Uses the sun and a series of tanks containing plants, snails, zooplankton, crayfish, and fish (that can be eaten or sold for bait). Figure 21-1
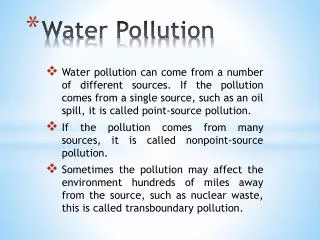
WATER POLLUTION: SOURCES, TYPES, AND EFFECTS • Water pollution is any chemical, biological, or physical change in water quality that has a harmful effect on living organisms or makes water unsuitable for desired uses. • Point source: specific location (drain pipes, ditches, sewer lines). • Nonpoint source: cannot be traced to a single site of discharge (atmospheric deposition, agricultural / industrial / residential runoff)
Major Water Pollutants and Their Effects • A fecal coliform bacteria test is used to indicate the likely presence of disease-causing bacteria in water. Figure 21-2
Major Water Pollutants and Their Effects • Water quality and dissolved oxygen (DO) content in parts per million (ppm) at 20°C. • Only a few fish species can survive in water less than 4ppm DO at 20°C. Figure 21-3
POLLUTION OF FRESHWATER STREAMS • Flowing streams can recover from a moderate level of degradable water pollutants if they are not overloaded and their flows are not reduced. • In a flowing stream, the breakdown of degradable wastes by bacteria depletes DO and creates and oxygen sag curve. • This reduces or eliminates populations of organisms with high oxygen requirements.
Water Pollution Problems in Streams • Dilution and decay of degradable, oxygen-demanding wastes and heat in a stream. Figure 21-4
Normal clean water organisms (Trout, perch, bass, mayfly, stonefly) Trash fish (carp, gar, leeches) Fish absent, fungi, sludge worms, bacteria (anaerobic) Trash fish (carp, gar, leeches) Clean Normal clean water organisms (Trout, perch, bass, mayfly, stonefly) Types of organisms 8 ppm Dissolved oxygen (ppm) 8 ppm Clean Zone Biological oxygen demand Recovery Zone Septic Zone Decomposition Zone Clean Zone Fig. 21-4, p. 497
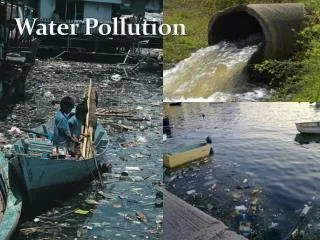
POLLUTION OF FRESHWATER STREAMS • Most developed countries have sharply reduced point-source pollution but toxic chemicals and pollution from nonpoint sources are still a problem. • Stream pollution from discharges of untreated sewage and industrial wastes is a major problem in developing countries.
Global Outlook: Stream Pollution in Developing Countries • Water in many of central China's rivers are greenish black from uncontrolled pollution by thousands of factories. Figure 21-5
Case Study: India’s Ganges River: Religion, Poverty, and Health • Religious beliefs, cultural traditions, poverty, and a large population interact to cause severe pollution of the Ganges River in India. • Very little of the sewage is treated. • Hindu believe in cremating the dead to free the soul and throwing the ashes in the holy Ganges. • Some are too poor to afford the wood to fully cremate. • Decomposing bodies promote disease and depletes DO.
Case Study: India’s Ganges River: Religion, Poverty, and Health • Daily, more than 1 million Hindus in India bathe, drink from, or carry out religious ceremonies in the highly polluted Ganges River. Figure 21-6
POLLUTION OF FRESHWATER LAKES • Dilution of pollutants in lakes is less effective than in most streams because most lake water is not mixed well and has little flow. • Lakes and reservoirs are often stratified and undergo little mixing. • Low flow makes them susceptible to runoff. • Various human activities can overload lakes with plant nutrients, which decrease DO and kill some aquatic species.
Cultural Eutrophication • Eutrophication: the natural nutrient enrichment of a shallow lake, estuary or slow moving stream, mostly from runoff of plant nutrients from the surrounding land. • Cultural eutrophication: human activities accelerate the input of plant nutrients (mostly nitrate- and phosphate-containing effluents) to a lake. • 85% of large lakes near major population centers in the U.S. have some degree of cultural eutrophication.
POLLUTION OF GROUNDWATER • Groundwater can become contaminated with a variety of chemicals because it cannot effectively cleanse itself and dilute and disperse pollutants. • The drinking water for about half of the U.S. population and 95% of those in rural areas comes from groundwater.
Polluted air Pesticides and fertilizers Hazardous waste injection well Deicing road salt Coal strip mine runoff Buried gasoline and solvent tanks Gasoline station Pumping well Cesspool, septic tank Water pumping well Waste lagoon Sewer Leakage from faulty casing Landfill Accidental spills Discharge Unconfined freshwater aquifer Confined aquifer Confined freshwater aquifer Groundwater flow Fig. 21-7, p. 501
POLLUTION OF GROUNDWATER • It can take hundreds to thousand of years for contaminated groundwater to cleanse itself of degradable wastes. • Nondegradable wastes (toxic lead, arsenic, flouride) are there permanently. • Slowly degradable wastes (such as DDT) are there for decades.
Leaking tank Aquifer Bedrock Water table Groundwater flow Free gasoline dissolves in groundwater (dissolved phase) Gasoline leakage plume (liquid phase) Migrating vapor phase Water well Contaminant plume moves with the groundwater Fig. 21-8, p. 502
POLLUTION OF GROUNDWATER • Leaks from a number of sources have contaminated groundwater in parts of the world. • According the the EPA, one or more organic chemicals contaminate about 45% of municipal groundwater supplies. • By 2003, the EPA had completed the cleanup of 297,000 of 436,000 underground tanks leaking gasoline, diesel fuel, home heating oil, or toxic solvents.
Case Study: Arsenic in Groundwater - a Natural Threat • Toxic Arsenic (As) can naturally occur at high levels in soil and rocks. • Drilling into aquifers can release As into drinking water supplies. • According to WHO, more than 112 million people are drinking water with As levels 5-100 times the 10 ppb standard. • Mostly in Bangladesh, China, and West Bengal, India.
Solutions Groundwater Pollution Prevention Cleanup Pump to surface, clean, and return to aquifer (very expensive) Find substitutes for toxic chemicals Keep toxic chemicals out of the environment Inject microorganisms to clean up contamination (less expensive but still costly) Install monitoring wells near landfills and underground tanks Require leak detectors on underground tanks Pump nanoparticles of inorganic compounds to remove pollutants (may be the cheapest, easiest, and most effective method but is still being developed) Ban hazardous waste disposal in landfills and injection wells Store harmful liquids in aboveground tanks with leak detection and collection systems Fig. 21-9, p. 504
OCEAN POLLUTION • Oceans, if they are not overloaded, can disperse and break down large quantities of degradable pollutants. • Pollution of coastal waters near heavily populated areas is a serious problem. • About 40% of the world’s population lives near on or near the coast. • The EPA has classified 4 of 5 estuaries as threatened or impaired.
Industry Nitrogen oxides from autos and smokestacks, toxic chemicals, and heavy metals in effluents flow into bays and estuaries. Cities Toxic metals and oil from streets and parking lots pollute waters; Urban sprawl Bacteria and viruses from sewers and septic tanks contaminate shellfish beds Construction sites Sediments are washed into waterways, choking fish and plants, clouding waters, and blocking sunlight. Farms Runoff of pesticides, manure, and fertilizers adds toxins and excess nitrogen and phosphorus. Red tides Excess nitrogen causes explosive growth of toxicmicroscopic algae, poisoning fish and marine mammals. Closed shellfish beds Closed beach Oxygen-depleted zone Toxic sediments Chemicals and toxic metals contaminate shellfish beds, kill spawning fish, and accumulate in the tissues of bottom feeders. Oxygen-depleted zone Sedimentation and algae overgrowth reduce sunlight, kill beneficial sea grasses, use up oxygen, and degrade habitat. Healthy zone Clear, oxygen-rich waters promote growth of plankton and sea grasses, and support fish. Fig. 21-10, p. 505
OCEAN POLLUTION • Harmful algal blooms (HAB) are caused by explosive growth of harmful algae from sewage and agricultural runoff. Figure 21-11
Oxygen Depletion in the Northern Gulf of Mexico • A large zone of oxygen-depleted water forms for half of the year in the Gulf of Mexico as a result of HAB. Figure 21-A
Missouri River Mississippi River Basin Ohio River Mississippi River MS LA LOUISIANA Mississippi River TX Depletedoxygen Gulf of Mexico Gulf of Mexico Fig. 21-A, p. 507
Case Study: The Chesapeake Bay – An Estuary in Trouble • Pollutants from six states contaminate the shallow estuary, but cooperative efforts have reduced some of the pollution inputs. Figure 21-12
OCEAN OIL POLLUTION • Most ocean oil pollution comes from human activities on land. • Studies have shown it takes about 3 years for many forms of marine life to recover from large amounts of crude oil(oil directly from ground). • Recovery from exposure to refined oil (fuel oil, gasoline, etc…) can take 10-20 years for marine life to recover.
OCEAN OIL POLLUTION • Tanker accidents and blowouts at offshore drilling rigs can be extremely devastating to marine life (especially diving birds, left). Figure 21-13
Solutions Coastal Water Pollution Prevention Cleanup Reduce input of toxic pollutants Improve oil-spill cleanup capabilities Separate sewage and storm lines Ban dumping of wastes and sewage by maritime and cruise ships in coastal waters Sprinkle nanoparticles over an oil or sewage spill to dissolve the oil or sewage without creating harmful by-products (still under development) Ban ocean dumping of sludge and hazardous dredged material Protect sensitive areas from development, oil drilling, and oil shipping Require at least secondary treatment of coastal sewage Regulate coastal development Use wetlands, solar-aquatic, or other methods to treat sewage Recycle used oil Require double hulls for oil tankers Fig. 21-14, p. 509
PREVENTING AND REDUCING SURFACE WATER POLLUTION • The key to reducing nonpoint pollution – most of it from agriculture – is to prevent it from reaching bodies of water. • Farmers can reduce runoff by planting buffers and locating feedlots away from steeply sloped land, flood zones, and surface water.
PREVENTING AND REDUCING SURFACE WATER POLLUTION • Most developed countries use laws to set water pollution standards, but such laws rarely exist in developing countries. • The U.S. Clean Water Act sets standards fro allowed levels of key water pollutants and requires polluters to get permits. • EPA is experimenting with a discharge trading policy similar to that for air pollution control.
Reducing Water Pollution through Sewage Treatment • Septic tanks and various levels of sewage treatment can reduce point-source water pollution. Figure 21-15
Reducing Water Pollution through Sewage Treatment • Raw sewage reaching a municipal sewage treatment plant typically undergoes: • Primary sewage treatment: a physical process that uses screens and a grit tank to remove large floating objects and allows settling. • Secondary sewage treatment: a biological process in which aerobic bacteria remove as much as 90% of dissolved and biodegradable, oxygen demanding organic wastes.
Reducing Water Pollution through Sewage Treatment • Primary and Secondary sewage treatment. Figure 21-16
Reducing Water Pollution through Sewage Treatment • Advanced or tertiary sewage treatment: • Uses series of chemical and physical processes to remove specific pollutants left (especially nitrates and phosphates). • Water is chlorinated to remove coloration and to kill disease-carrying bacteria and some viruses (disinfect).
Reducing Water Pollution through Sewage Treatment • Sewage sludge can be used as a soil conditioner but this can cause health problems if it contains infectious bacteria and toxic chemicals. • Preventing toxic chemicals from reaching sewage treatment plants would eliminate such chemicals from the sludge and water discharged from such plants.
Odors Odors may cause illness or indicate presence of harmful gases. Dust Particles Particles of dried sludge carry viruses and harmful bacteria that can be inhaled, infect cuts or enter homes. BUFFER ZONE Exposure Children may walk or play in fertilized fields. Livestock Poisoning Cows may die after grazing on sludge-treated fields. Sludge Groundwater Contamination Harmful chemicals and pathogens may leach into groundwater and shallow wells. Surface Runoff Harmful chemicals and pathogens may pollute nearby streams,lakes, ponds, and wetlands. Fig. 21-17, p. 513
Reducing Water Pollution through Sewage Treatment • Natural and artificial wetlands and other ecological systems can be used to treat sewage. • California created a 65 hectare wetland near Humboldt Bay that acts as a natural wastewater treatment plant for the town of 16,000 people. • The project cost less than half of the estimated price of a conventional treatment plant.
Reducing Water Pollution through Sewage Treatment • Water pollution laws have significantly improved water quality in many U.S. streams and lakes but there is a long way to go. • Some want to strengthen the U.S. Clean Water Act (CWA) to prevent rather than focusing on end-of-the-pipe removal. • Many farmers and developers see the CWA as limiting their rights as property owners to fill in wetlands.
DRINKING WATER QUALITY • Centralized water treatment plants and watershed protection can provide safe drinking water for city dwellers in developed countries. • Simpler and cheaper ways can be used to purify drinking water for developing countries. • Exposing water to heat and the sun’s UV rays for 3 hours can kill infectious microbes.
Using Laws to Protect Drinking Water • While most developed countries have drinking water quality standards and laws, most developing countries do not. • The U.S Safe Drinking Water Act requires the EPA to establish national drinking water standards (maximum contaminant levels) for any pollutant that may have adverse effects on human health.
Using Laws to Protect Drinking Water • The U.N. estimates that 5.6 million Americans drink water that does not meet EPA standards. • 1 in 5 Americans drinks water from a treatment plant that violated one or more safety standard. • Industry pressures to weaken the Safe Drinking Act: • Eliminate national tests and public notification of violations. • Allow rights to pollute if provider cannot afford to comply.
Is Bottled Water the Answer? • Some bottled water is not as pure as tap water and costs much more. • 1.4 million metric tons of plastic bottles are thrown away. • Fossil fuels are used to make plastic bottles. • The oil used to produce plastic bottles in the U.S. each year would fuel 100,000 cars.
Solutions Water Pollution • Prevent groundwater contamination • Reduce nonpoint runoff • Reuse treated wastewater for irrigation • Find substitutes for toxic pollutants • Work with nature to treat sewage • Practice four R's of resource use (refuse, reduce, recycle, reuse) • Reduce air pollution • Reduce poverty • Reduce birth rates Fig. 21-18, p. 517
What Can You Do? Water Pollution • Fertilize garden and yard plants with manure or compost instead of commercial inorganic fertilizer. • Minimize your use of pesticides. • Do not apply fertilizer or pesticides near a body of water. • Grow or buy organic foods. • Do not drink bottled water unless tests show that your tap water is contaminated. Merely refill and reuse plastic bottles with tap water. • Compost your food wastes. • Do not use water fresheners in toilets. • Do not flush unwanted medicines down the toilet. • Do not pour pesticides, paints, solvents, oil, antifreeze, or other products containing harmful chemicals down the drain or onto the ground. Fig. 21-19, p. 517