Download
1 / 36
360 likes | 692 Vues
Water Pollution. Chapter 11 in textbook (Keller, 2000) For this section, and all sections in this course, look up and study all concepts and terms in various resources: other textbooks library books journal articles websites (in addition to the links in this presentation)

E N D
Water Pollution • Chapter 11 in textbook (Keller, 2000) • For this section, and all sections in this course, look up and study all concepts and terms in various resources: • other textbooks • library books • journal articles • websites (in addition to the links in this presentation) • Diagrams in this presentation are fromKeller (2000) and various other sources, including the online version of this course. S. Hughes, 2003
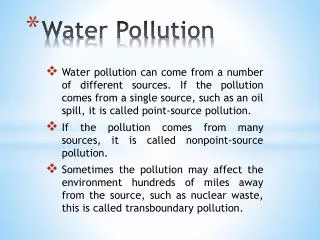
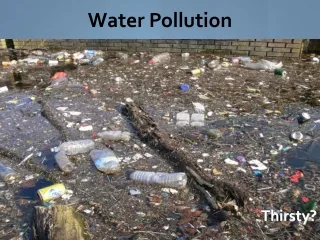
Water Pollution • Water pollution = Water contains an excessof a biological, chemical, or physical compound that makes it harmful to living organisms. • How much is excess? • It is any concentration level above that which is harmful. It is a function of: • size of the reservoir • residence time within that system • toxicity of the contaminant • type of living organism harmed by pollutant • What may be highly diluted in a large reservoir may be harmful or lethal in a small pond. • Pollution occurs in surface and subsurface water. Subsurface contamination is more difficult to detect and much more difficult to clean up than surface contamination.
Water Pollution • Common sources of groundwater pollution or contamination • -------------------------------------------------------------------------------------- • Leaks from storage tanks and pipes • Leaks from waste disposal sites such as landfills • Seepage from septic systems and cesspools • Accidental spills and seepage (e.g., trucks and trains) • Seepage from agricultural activities such as feedlots • Intrusion of salt water into coastal aquifers • Leaching and seepage from mine spoil piles and tailings • Seepage from spray irrigation • Improper operation of injection wells • Seepage of acid water from mines • Seepage of irrigation return flow • Infiltration of urban, industrial, and agricultural runoff • -------------------------------------------------------------------------------------- • (from Keller, 2000, Table 11.1) • Chloride is a good example of a pollutant that has many sources. S. Hughes, 2003
Nutrients Nutrients, such as nitrogen(N) and phosphorus (P), are essential for plant growth. Plants lacking these elements lose their color or are stunted. The concentrations of N and P are related to land use. Agricultural areas contain the highest concentrations, whereas forested regions have the lowest. Agricultural land is often depleted in nitrogen and phosphorus. Therefore, fertilizers containing such elements are added to the soil for growing crops. Excess N and P eventually filters into river systems. Nutrients are also added to groundwater from feedlots, such as these in the western U.S.
Nutrients Relation between land use and average N and P concentrations in streams (mg/L); from Council on Environmental Quality, 1978. (from Keller, 2000, Figure 11.3) S. Hughes, 2003
Nutrients Detergents are also pollutants. Phosphates were formerly major constituents in detergents, so water pollution ocurred as a by-product of phosphate-based detergents. Now, there is restricted use of phosphates in the USA and Canada, except for hospitals and institutions. Therefore, phosphate-based detergents still contribute to water pollution. Wastewater treatment plants also contribute to water pollution. Although treatment reduces organic pollutants and pathogens, nitrogen and phosphorus are discharged into adjacent streams, lakes, or the ocean. S. Hughes, 2003
Nutrients High concentrations of N and P result in accelerated growth of plant life, particularly algae. This process, known as cultural eutrophication, causes thick mats of algae (algal bloom) to grow on freshwater ponds and lakes. Eutrophication may kill fish and aquatic animals. Red Tide: A small number of algae species produce potent neurotoxins that can be transferred through the food chain. Eutrophication of red-pigmented marine algae (dinoflagellates) results in "red tide." Harvesting shellfish (clams, oysters, scallops) is prohibited during red tides due to toxic effects from ingested algae, S. Hughes, 2003
Nutrients Ocean beaches lined with thick layers of rotting seaweed (which is marine algae) also indicate cultural eutrophication in near-shore environments. In tropical areas, excess algae can cover coral beds, damaging or killing it. Sediment Eroded sediment (either natural or man-induced) is probably our greatest pollutant. It reduces water quality. It can choke streams and fill ponds, lakes, and reservoirs. Sediment in a useful setting is known as soil, which of course is a natural resource. S. Hughes, 2003
Oxygen-Demanding Waste Bacteria are present everywhere. Some bacteria (including stream types) are decomposers, consuming dead organic material, a process that requires oxygen. High concentrations of dead organic matter (by natural processes, agriculture, or combined sewage-storm water runoff) cause bacteria to multiply rapidly, reducing oxygen levels. Aquatic organisms that require oxygen suffer and may die as a result. Recovery time depends on the available oxygen supply and the amount of pollution that has occurred. Biochemical Oxygen Demand (BOD) = The amount of oxygen used for bacterial decomposition. BOD is frequently used to determine water quality. High BOD = low O2 concentration and high decomposition activity. S. Hughes, 2003
Oxygen-Demanding Waste BOD is measured as milligrams per liter of oxygen (mg/LO2) consumed over a 5-day period at 20° C. Relation between dissolved O2 and BOD in a stream following the input of raw sewage. (from Keller, 2000, Figure 11.2) S. Hughes, 2003
Pathogenic Organisms Cholera, typhoid fever, hepatitis A, and dysentery are waterborne pathogenic diseases. Such microorganisms can exist in fecal waste. Certain strains ofE. Coli are associated with these diseases. E. coli bacteria E. Coli is one category of fecal coliform bacteria that live in the lower intestines of all warm-blooded animals, including humans. Fecal coliform bacteria, including many strains of E. Coli, are harmless to humans. However, fecal coliform in streams or other water supplies indicates contamination from fecal waste and potential health risks for individuals exposed to this water. Fecal coliform is measured using unfiltered water samples. After the samples are incubated, the growth rate is determined. The threshold concentration for declaring water to be contaminated with fecal coliform is 200 cells per 100 mL water. S. Hughes, 2003
Oil spills cause havoc in the environment. The worst spills have resulted from oil-tanker accidents at sea. The Exxon Valdez (in 1989) is an example of a crude oil spill into a pristine marine environment. This environmental disaster had a major impact on wildlife in the area. Thermal pollution occurs when industrial plants emit artificially heated water into natural water environments. The effects may be positive or negative. Heated water holds less oxygen than cooler water and may cause changes in growth or respiration rates and may change developmental rates of existing organisms. Some may become more vulnerable to toxic pollutants in the water. Diseases and parasites may become more effective at higher temperatures. Some species that are intolerant to warm conditions may actually disappear. On the other hand, warmer water may result in better survival conditions for existing fish and plant life.
Toxic materials • Industry, mining activities, and agriculture are responsible for releasing toxic materials into our environment. Relatively high concentrations of such materials, present in some soil, water and plants, have been associated with biological problems in humans and animals. Serious pollution problems occur when toxic materials are released into the environment. There are two major types of toxic materials: • Heavy metals = Industrial metals, such as lead (Pb), mercury (Hg), cadmium (Cd), chromium (Cr), zinc (Zn), and nickel (Ni). Even iron (Fe as soluble FeO or insoluble Fe2O3) can be detrimental to water quality. • Hazardous chemicals = Synthetic organic and inorganic compounds that are toxic to humans and other living things. • Heavy metals and hazardous chemicals are also found in areas of soil pollution, which is usually linked to water pollution. S. Hughes, 2003
Mine Waste Pollution Base metals such as zinc, lead, copper, and molybdenum, are mined as sulfides. Most of these mines have abundant iron sulfide (pyrite, FeS2) which is typically left behind in favor of sulfides rich in other metals. Abandoned, old, or even working sulfide mines often have seepage of water through the mine and through spoils and tailings that oxidizes sulfide to Fe2O3 and H2SO4 (sulfuric acid). This effect also occurs in coal mines, where coal contains significant amounts of sulfide. Sulfuric acid infiltrates soil and flows into streams and the groundwater system. Acidic solutions are detrimental to wildlife and often carry high concentrations of heavy metals associated with the sulfide deposits. Water pollution can be remediated only when the acids are neutralized and the mine is reclaimed to eliminate infiltration of water to sulfides. Review pH (website) and pH (Chemistry notes) to understand more about acids and bases in water. S. Hughes, 2003
Common Chemicals Found at Superfund Sites U. S. Environmental Protection Agency (EPA) designated Superfund sites. • Acetone • Aldrin/Dieldrin • Arsenic • Barium • Benzene • 2-Butanone • Cadmium • Carbon Tetrachloride • Chlordane • Chloroform • Chromium • Cyanide • DDT, DDE, DDD • 1,1-Dichloroethene • 1,2-Dichloroethane • Lead • Mercury • Methylene Chloride • Naphthalene • Nickel • Pentachlorophenol • Polychlorinated Biphenyls (PCBs) • Polycyclic Aromatic Hydrocarbons • (PAHs) • Tetrachloroethylene • Toluene • Trichloroethylene • Vinyl Chloride • Xylene • Zinc S. Hughes, 2003
National Primary Drinking Water Standards: Examples • Contaminant Max. Level (mg/L) Problems • Inorganic Chemicals • Arsenic 0.05 Highly toxic • Cadmium 0.01 Kidney • Lead 0.015 Highly toxic • Mercury 0.002 Kidney, nervous system • Selenium 0.01 Nervous system • Asbestos 7 MFL* Benign tumors • Fluoride 4 Skeletal damage • Organic Chemicals • Endrin (pesticide) 0.0002 Nervous system, kidney • Lindane (pesticide) 0.004 Nervous system, kidney • Methoxychlor (pest.) 0.1 Nerv. Sys., kidney, liver • 2,4D (herbicide) 0.07 Liver, kidney, Nerv. Sys. • Silvex (herbicide) 0.05 Nerv. Sys., liver, kidney S. Hughes, 2003
National Primary Drinking Water Standards: • More Examples • Contaminant Max. Level (mg/L) Problems • Volatile Organic Chemicals • Benzene 0.005 Cancer • Carbon Tetrachloride 0.005 Possible cancer • Trichloroethylene 0.005 Probably cancer • Vinyl Chloride 0.002 Cancer risk • Microbial Organisms • Fecal coliform bact. 1 cell/100 ml Indicator • disease-causing • organisms • (from Keller, 2000, Table 11.3) • * MFL = million fibers per liter with fiber length > 10 microns • NOTE: For additional information see the U.S.G.S National Analysis of Trace Elements and Water Quality programs. S. Hughes, 2003
Water Quality in the U.S. Freshwater organisms are used to help determine water quality. The concentration of selected toxic metals (a) and toxic organic chemicals (b) in fish tissue, measured at monitoring stations by U.S. Fish and Wildlife Service between 1970 and 1986. (from Keller, 2000, Figure 11.9) S. Hughes, 2003
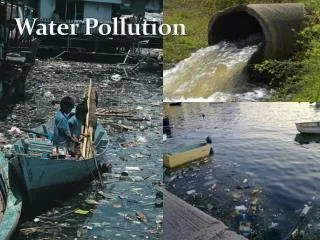
Surface water pollution • Pollution comes from point sources and non-point sources. • Point sources = industrial sites and outflows for sewer-stormwater runoff systems. • Non-point sources = pollution runoff. Land uses (urban and rural) and surface runoff factors (ex. geology, climate, and topography) greatly affect pollution runoff. Everyday human activities are also contributors. Driving automobiles and trucks add to road grime. Fertilizing the lawn or garden, washing the car, or even walking the dog are contributors as well. • Urban contributors = factories, parking lots, storage sites. • Rural contributors = farming, forestry, mining. • Rain causes pollutants to runoff and infiltrate over large areas. S. Hughes, 2003
Treating surface water pollution • Many rivers were once treated as dumping sites. Chemicals, garbage, oil and gas discharge, and raw sewage were added to rivers on a daily basis. Pristine rivers virtually became open sewers. Conditions were so deplorable, some rivers were considered dead, devoid of life. Humans now understand that it is important to eliminate the source of pollution. • Treatment of polluted surface water takes many forms, for example: • Pass new laws (and enforce them!) • Develop better technology to reduce pollution levels. • Remove developments along rivers and lakes. • Reconstruct natural habitats in riparian areas and along shorelines. • Build treatment plants to process water used in agriculture and industry before release to the environment.
Groundwater pollution Groundwater pollution results from harmful chemicals infiltrating into groundwater systems. Groundwater pollution is an ongoing problem in many urban and industrial areas especially, but it can occur anywhere. A pollution plume occurs when toxic wastes are released into the environment. Contaminant migration will follow the flow paths of groundwater, typically perpendicular to water table contours, and move in the direction of decreasing concentration. NOTE: Pollution plumes in groundwater are much like plumes of smoke emitted from smokestacks. Although the fluid media are different (atmosphere vs. aquifer, and smoke goes up, not down), groundwater pollution plumes behave in much the same way as smoke plumes. Both are subject to variations in flow rate and dispersion. S. Hughes, 2003
S. Hughes, 2000 Idealized isoconcentration map Other plume shapes 1 0.9 0.5 0.1 0.01 Point source (1 = max. concentration) Groundwater Pollution Plumes Specific concentration data (measured by sampling groundwater from wells and then analyzing it) is used to construct a contaminant isoconcentration map. Like a flow net, these maps join lines, or contours, of equal concentration called isopleths. An idealized isoconcentration map of a pollutant plume depicts the pattern of relative concentration levels at increasing distance from a continuous source. SEE PLUME NOTES (PDF file)
Salt Water Intrusion A groundwater system near the coast may be contaminated with salt water when freshwater is pumped from wells. Intense pumping will cause a cone of ascension to become drawn upwards, delivering salt water to the well. (from Keller, 2000, Figure 11.7) Natural Conditions Pumping Conditions S. Hughes, 2003
Groundwater Treatment • Groundwater pollution cannot be avoided; therefore, we must be prepared to help nature clean up our problems. Before actual clean up procedures begin, it is vital that the geological and hydrological characteristics are understood. It is also essential to know which contaminants are being dealt with, as well as their transport processes. • Insoluble contaminants form a separate, non-aqueous phase. • Compounds with a specific gravity lower than water float on water (example = gasoline), and are called light non-aqueous phase liquids (LNAPL). • Compounds with a specific gravity higher than water sink below the water (example = trichoroethylene/TCE), and are called dense non-aqueous phase liquids (DNAPL). • Soluble contaminants (example = salts) flow with the water. S. Hughes, 2003
Groundwater Treatment • Four methods are used for treating contaminated groundwater and vadose zone water: • Extraction Wells -- Contaminated water is pumped out of the aquifer and then treated by aeration (oxidation), filtering, air stripping (volatilization in an air column), or biological processes. • Vapor Extraction -- The contaminant is removed while it is in a vapor phase, usually in the vadose zone. • Bioremediation -- Microbes degrade the contaminants. The microbes either exist naturally (nutrients and oxygen are injected), or they have to be prepared in a bioreactor and added to the vadose zone or saturated zone. • Permeable Treatment Beds -- Filters are used to treat contaminants by physical, chemical, or biological processes while water flows through a treatment bed. S. Hughes, 2003
Groundwater Treatment Vapor phase pollution exists in most urban areas. Older service stations commonly have cracked and leaky underground gasoline storage tanks. Seepage filtrates down through the vadose zone onto the water table. Leaking underground storage tanks (LUST) add gasoline to groundwater and gasoline vapors to the vadose zone where they can infiltrate underground structures. S. Hughes, 2003
Groundwater Treatment Dewatering wells and vapor extraction wells are used to remove the offending gas contaminant. Pollution from leaking underground storage tanks can be remediated, but this type of remediation is expensive and can be difficult. S. Hughes, 2003
Wastewater treatment The USA has laws stating that wastewater (industrial, municipal, and sewage) must be treated before releasing it into the environment. Septic tank disposal systems are common in rural areas. Urban communities generally have municipal systems collecting wastewater for treatment in a central location. Diagram of a septic-tank sewage disposal system for a single house. (from Keller, 2000, Figure 11.10) S. Hughes, 2003
Septic tank systems Almost 30% of the U.S. population uses septic tank systems for sewage disposal. Unfortunately, not all locations are suitable for this method. Local geology is the key. Percolation tests (commonly called a perc test) are used to determine septic tank suitability. Water movement through the soil (absorption field) is the determining factor. Good drainage purifies the water as it percolates down through the soil into the groundwater system. Anything else results in polluted water! When a septic system fails, waste may rise to the surface above the drainage field. The problem is easily visible, but processes beneath the ground are difficult to see. If extensive leaching of waste occurs, then groundwater resources may become polluted, especially around failed septic systems that serve small commercial and industrial activities (which dispose more nutrients, heavy metals, and organic chemicals).
Wastewater treatment plants • Obviously, the purpose of a wastewater treatment plant is to remove contaminants. This is typically a 2- or 3-step process. • Primary treatment -- removes mucky sediment or sludge (30-40% of the wastewater pollutants) using screens, a grit chamber and sedimentation tank, from which the sludge goes to a digester. • Secondary treatment -- Wastewater moves into the aeration tank where air is pumped in and aerobic bacteria break down organic material. The water goes to a final sedimentation tank which allows more sludge to settle out. • Digester uses anaerobic bacteria to digest organic compounds left in the sedimentation tanks and produces methane in the process. The methane can be used to run equipment or to cool/heat the processing plant. • Disinfecting the water, usually with chlorine, is the final step in the secondary process. S. Hughes, 2003
Wastewater treatment plants (from Keller, 2000, Figure 11.11) NOTE: If heavy metals, nutrients, or certain chemicals are present, advanced treatment is needed. Chemicals, carbon filters, or sand filters are used for advanced treatment. Wastewater that has undergone advanced treatment is called reclaimed water, which can be used for watering parks, golf courses, farm fields, or wildlife habitats. S. Hughes, 2003
Wastewater Renovation After wastewater has been processed, it is perhaps 95% clean. The sludge has been removed. Many communities now consider wastewater and sludge to be recovered resources, and they recycle it. The process of recycling liquid waste is called the wastewater renovation and conservation cycle. Treated wastewater is (1) returned to crops by sprinkler systems; (2) water is renovated by slow percolation downward to become naturally purified and recharge the groundwater resource; and (3) water is pumped out of the ground for reuse by industrial, municipal, institutional, or agricultural purposes. Sludge is used to improve soil texture and soil quality. It is used in mining reclamation projects and other landfill processes. S. Hughes, 2003
Resource-Recovery Wastewater Treatment Idealized system of recovering resources during wastewater treatment: methane from anaerobic beds, ornamental flowers, and more. (from Keller, 2000, Figure 11.13) S. Hughes, 2003
Water Pollution Questions to Think About: • What are the three most common forms of water pollution in your local community? • How severe are these water pollution problems? • What potential and actual pollution-related harms exist? • What is being done to correct these problems? • What five ways could you help? • Is cultural eutrophication a problem near your home? • Can you identify point and non-point pollution sources? • Visit a wastewater treatment plant sometime; are biological processes being used there? What are the advantages and disadvantages of using biological systems (such as plants) in the treatment process? • How safe is your water supply? If you drink bottled water, how safe is it? What is the basis for your answer? S. Hughes, 2003
Water Pollution Exercise The Magic Gulch Water and Waste Problem This exercise involves water table contours, flow lines and a simple flow net. Calculations are made based on Darcy’s Law and all work must be shown. Use separate sheets if necessary. Answers to questions require general knowledge of pollution and groundwater systems. Use all information and knowledge that will help provide a meaningful assessment of the problem. Help will be provided if necessary. S. Hughes, 2003
Terms to Understand acid mine drainagealgaebacteriabiochemical oxygen demandbioremediationcarbon filtercontaminationcultural eutrophicationdetergentdinoflagellateextraction wellfecal coliform bacteriafertilizergroundwaternon-point sourcenutrientorganic pollutantpathogen point sourcepollutionprimary treatmentreclaimed waterreservoirresidence timesalt-water intrusionsedimentsecondary treatmentseptic tanksubsurfacethermal pollutiontreatment bedvadose zonevapor extractionwastewaterwastewater treatmentwater quality S. Hughes, 2003