Download
1 / 86
870 likes | 1.03k Vues
Explore John Todd's Living Machine, a natural wastewater treatment system utilizing aquatic plants and microorganisms to filter pollutants. Learn about water pollution categories and harmful effects of infectious agents, oxygen-demanding wastes, inorganic chemicals, organic chemicals, plant nutrients, sediment, radioactive materials, and heat pollution. Discover eco-friendly water purification techniques and the importance of safeguarding water quality for human and environmental health. |

E N D
Water Pollution Chapter 22
John Todd’s Living Machine • Sewage flows into passive solar greenhouse or outdoor sites containing rows of large open tanks • 1st tanks- algae & microorganisms decompose organic wastes • Water hyacinths, cattails, bulrushes, other aquatic plants use remaining nutrients
Water runs through artificial marsh (sand, gravel, bulrush plants) that filters out algae & remaining organic wastes • Aquarium tasks- snails & zooplankton consume microorganisms & in turn are consumed by crayfish, tilapia, other fish & can be eaten or sold as bait
10 days later- 2nd artificial marsh • Purified for drinking by exposing to UV light or passing through ozone generator
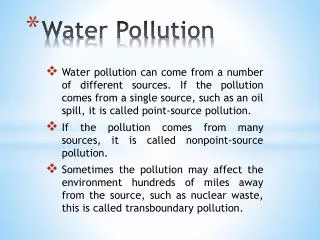
Water Pollution • Any chemical, biological, or physical change in water quality that has a harmful effect on living organisms or makes water unsuitable for desired uses
Table 22-1Page 492 Table 22-1 Major Categories of Water Pollutants INFECTIOUS AGENTS Examples: Bacteria, viruses, protozoa, and parasitic worms Major Human Sources: Human and animal wastes Harmful Effects: Disease
Table 22-1Page 492 Table 22-1 Major Categories of Water Pollutants OXYGEN-DEMANDING WASTES Examples: Organic waste such as animal manure and plant debris that can be decomposed by aerobic (oxygen-requiring) bacteria Major Human Sources: Sewage, animal feedlots, paper mills, and food processing facilities Harmful Effects: Large populations of bacteria decomposing these wastes can degrade water quality by depleting water of dissolved oxygen. This causes fish and other forms of oxygen-consuming aquatic life to die.
Table 22-1Page 492 Table 22-1 Major Categories of Water Pollutants INORGANIC CHEMICALS Examples: Water-soluble 1) acids, (2) compounds of toxic metals such as lead (Pb), arsenic (As), and selenium Se), and (3) salts such as sodium chloride (NaCl) in ocean water and fluorides (F–) found in some soils Major Human Sources: Surface runoff, industrial effluents, and household cleansers Harmful Effects: Can (1) make fresh water unusable for drinking or irrigation, (2) cause skin cancers and crippling spinal and neck damage (F–), (3) damage the nervous system, liver, and kidneys (Pb and As), (4) harm fish and other aquatic life, (5) lower crop yields, and (6) accelerate corrosion of metals exposed to such water.
Table 22-1Page 492 Table 22-1 Major Categories of Water Pollutants ORGANIC CHEMICALS Examples: Oil, gasoline, plastics, pesticides, cleaning solvents, detergents Major Human Sources: Industrial effluents, household cleansers, surface runoff from farms and yards Harmful Effects: Can (1) threaten human health by causing nervous system damage (some pesticides), reproductive disorders (some solvents), and some cancers (gasoline, oil, and some solvents) and (2) harm fish and wildlife.
Table 22-1Page 492 Table 22-1 Major Categories of Water Pollutants PLANT NUTRIENTS Examples: Water-soluble compounds containing nitrate (NO3–), phosphate (PO43–), and ammonium (NH4+) ions Major Human Sources: Sewage, manure, and runoff of agricultural and urban fertilizers Harmful Effects: Can cause excessive growth of algae and other aquatic plants, which die, decay, deplete water of dissolved oxygen, and kill fish. Drinking water with excessive levels of nitrates lowers the oxygen-carrying capacity of the blood and can kill unborn children and infants (“bluebaby syndrome”).
Table 22-1Page 492 Table 22-1 Major Categories of Water Pollutants SEDIMENT Examples: Soil, silt Major Human Sources: Land erosion Harmful Effects: Can (1) cloud water and reduce photosynthesis, (2) disrupt aquatic food webs, (3) carry pesticides, bacteria, and other harmful substances, (4) settle out and destroy feeding and spawning grounds of fish, and (5) clog and fill lakes, artificial reservoirs, stream channels, and harbors.
Table 22-1Page 492 Table 22-1 Major Categories of Water Pollutants RADIOACTIVE MATERIALS Examples: Radioactive isotopes of iodine, radon, uranium, cesium, and thorium Major Human Sources: Nuclear and coal-burning power plants, mining and processing of uranium and other ores, nuclear weapons production, natural sources Harmful Effects: Genetic mutations, miscarriages, birth defects, and certain cancers
Table 22-1Page 492 Table 22-1 Major Categories of Water Pollutants HEAT (THERMAL POLLUTION) Examples: Excessive heat Major Human Sources: Water cooling of electric power plants and some types of industrial plants. Almost half of all water withdrawn in the United States each year is for cooling electric power plants. Harmful Effects: Lowers dissolved oxygen levels and makes aquatic organisms more vulnerable to disease, parasites, and toxic chemicals. When a power plant first opens or shuts down for repair, fish and other organisms adapted to a particular temperature range can be killed by the abrupt change in water temperature—known as thermal shock.
Coliform Bacteria Count • Presence indicates that water has been exposed to human or animal waste (contains disease causing agents)
Dissolved Oxygen • Related to the amount of oxygen-demanding wastes (broken down by oxygen-requiring bacteria & plant nutrients)
Biological Indicators • Analyze aquatic plants (cattails) or bottom-dwellers (mussels) or filter feeders
Point Source Pollution • Discharge of pollutants at specific locations through drain pipes, ditches, or sewer lines into surface water • Factories • Underground mines • Sewage treatment plants • Oil tankers
Easy to identify, monitor, & regulate – due to specific location
Nonpoint Source Pollution • Large or dispersed land areas that discharge pollutants into environment over a large area • Acid deposition • Runoff from croplands, feedlots for livestock, logged forests, urban streets, lawns, golf courses, parking lots
Safe Drinking Water + 74-95% of people have access to clean drinking water - 1.4 billion people do NOT - 9,300 die daily due to infectious diseases spread by contaminated water or lack of water for adequate hygiene
Developing Countries • 26% of people do not have access to clean drinking water
Decreased Quality of Surface Water • Intense downpours = more chemicals, plant nutrients, & microorganisms • Massive flooding = spread of disease carrying pathogens into water treatment facilities & wells • Overflow of lagoons & sewer lines = raw sewage into rivers & streams
Drought = reduced river water to dilute waste • Spread of disease due to lack of water to keep clean • Warm temperatures = lower dissolved oxygen levels = higher growth rates of bateria
Pollution of Streams • Overloaded with pollutants • Drought • Damming or water diversion • Oxygen sag curve – depletion of DO by bacteria = reduced populations of organisms with high oxygen requirements
Normal clean water organisms (trout, perch, bass, mayfly, stonefly) Trash fish (carp, gar, leeches) Fish absent, fungi, sludge worms, bacteria (anaerobic) Trash fish (carp, gar, leeches) Normal clean water organisms (trout, perch, bass, mayfly, stonefly) 8 ppm Types of organisms 8 ppm Dissolved oxygen (ppm) Biological oxygen demand Clean Zone Recovery Zone Septic Zone Decomposition Zone Clean Zone Figure 22-5Page 496
Limiting Factors • Volume of degradable waste • Stream volume • Flow rate • Temperature • pH level
Controlling Stream Pollution in Developed Countries + Increased number & quality of water-water treatment plants + Industries are required to reduce or eliminate point-source pollution - Accidental or deliberate release of toxic, inorganic, & organic chemicals causes fish kills & contaminates drinking water
- Sewage treatment plants malfunction - Nonpoint runoff of pesticides & excess plant nutrients from cropland & animal feedlots
Controlling Stream Pollution in Developing Countries - Discharge of untreated sewage & industrial waste - Only 10% of Chinese city sewage is treated
Ganges River • Cremated bodies are returned to river (to increase chances for heaven) • Bodies are burned in open air wood fires • Some bodies are dumped into river only partially burned (decreases DO & adds bacteria & viruses) • Government adding sewage treatment plants & electric crematoriums
Diluting Lake Pollution • Less effective • Stratified layers with little vertical mixing • Little flow – water is replaced every 1-100 years (unlike days to weeks for streams)
Eutrophication • Physical, chemical, & biological changes that take place after receiving inputs of plant nutrients (nitrates & phosphates) from natural erosion & runoff
Cultural Eutrophication • Over nourishment of aquatic ecosystems with plant nutrients due to human activities (agriculture, urbanization, & discharge from industrial plants & sewage treatment plants
Eutrophication Prevention • Use advances (& expensive) waste treatment systems to remove nitrates & phosphates from waste water • Ban (or limit) use of phosphate in household detergents & other cleaning agents • Soil conservation & land-use control to reduce nutrient runoff
Eutrophication Cleanup • Mechanically remove excess weeds • Control plant growth with herbicides & algaecides • Pump air through lakes & reservoirs to avoid oxygen depletion
Lake Washington • Water was diverted into Puget Sound • Puget sound has rapid exchange rate with Pacific Ocean • Lake was NOT filled with weeds & sediment • Preventative action
The Great Lakes + Decreased algal blooms + Increased DO levels + Increased commercial fishing catches + New or upgraded sewage treatment plants + Better treatment of industrial wastes + Ban of phosphate containing cleansers
- August- low DO levels – kills fish & microorganisms - ¾ of shoreline is NOT clean enough for swimming - Nonpoint pollution is still high - Highly polluted sediments in hot spots - 80% drop in EPA funded cleanup
Groundwater Contamination • Leaking from industrial waste ponds (no liners) • Leaking of underground tanks (gasoline, diesel fuel, home heating oil, & toxic solvents) • Leaching of nitrate fertilizers • Soils & rock may contain arsenic • High levels of naturally occurring fluoride
Serious Problems because • Removal can be difficult & costly • Slow water movement • Pollutants can get easily into drinking water & irrigation water
As a Result • High fluoride levels= crippling spine & neck damage & variety of dental problems • High nitrate levels= cancers & “blue baby syndrome” (blood lacks the ability to carry sufficient oxygen) • High arsenic level= cancer (skin, bladder, lung)
Solutions Figure 22-10Page 503 Groundwater Pollution Prevention Cleanup Find substitutes for toxic chemicals Pump to surface, clean, and return to aquifer (very expensive) Keep toxic chemicals out of the environment Install monitoring wells near landfills and underground tanks Inject microorganisms to clean up contamination (less expensive but still costly) Require leak detectors on underground tanks Ban hazardous waste disposal in landfills and injection wells Pump nanoparticles of inorganic compounds to remove pollutants (may be the cheapest, easiest, and most effective method but is still being developed) Store harmful liquids in aboveground tanks with leak detection and collection systems
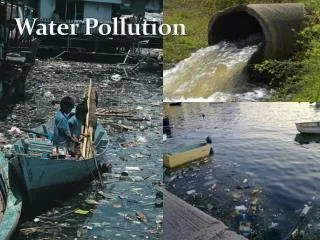
Ocean Pollution • Coastal areas- dumping of sewage & industrial waste, agricultural waste, algal blooms, oxygen-depleted zones (excessive fertilizers & animal wastes) • 40% of world population lives with 100km (62mi) of coast
Ocean Pollution from Rivers • Plant nutrients from river systems – causes algal blooms (red, brown, green) – releases waterborne & airborne toxins that damage fisheries, kills fish-eating birds, reduces tourism, & poisons seafood
Chesapeake Bay • Waste from point & nonpoint sources • Shallow bay • Sewage treatment & industrial plants • Runoff from urban, suburban, & agricultural land • Deposition from atmosphere
Integrated Coastal Management • Land-using regulations for agricultural & urban runoff • Ban phosphate detergents • Upgrade sewage treatment plants • Better monitoring of industrial discharge
Types of Ocean Pollution • Dredge spoils- materials (toxic metals) scraped from bottoms of harbors & rivers to clear shipping channels • Sewage sludge- gooey mixture of toxic chemicals, infectious agents, & settled solids removed from wastewater at sewage treatment plant
Ocean Oil Pollution • Waste oil dumped on ground, poured down drain, spilled, or leaked onto land or into sewers by cities, industries, & people changing motor oil
Oil & Ocean Ecosystem • Kills aquatic organisms (especially larval forms) • Coats bird feather & marine mammal fur (destroys natural insulation & buoyancy) • Smothers bottom-dwellers • Kills coral reef • Economic impact on coastal residents
Mechanical Cleanup • Floating booms = contain oil spills from reaching sensitive areas • Skimmer boats = vacuum up oil into collections barges • Absorbent devices = large mesh pillow filled with feathers or hair to soak up oil on beaches