Human Population
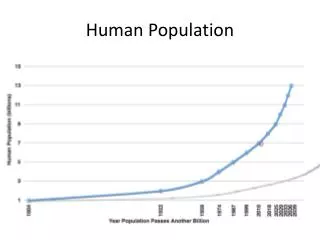
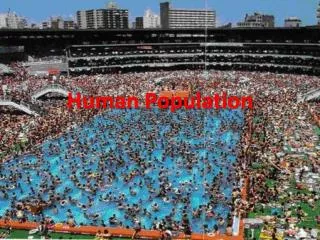
Human Population. World’s Scariest Line Graph. Carrying Capacity. The maximum number of organisms (of a particular species) that an ecosystem can support. Earth’s CC for humans is unknown (currently over 7 billion people).


Human Population
E N D
Presentation Transcript
Carrying Capacity • The maximum number of organisms (of a particular species) that an ecosystem can support. Earth’s CC for humans is unknown (currently over 7 billion people) Around 400 years ago, the human population began to increase rapidly, mainly due to changes in agriculture. Around 100 years ago the increase became more dramatic, mainly due to changes in medicine and industry.
British! • Thomas Malthus observed: The human population was growing exponentially but food supply was growing linearly. Scholar! Thomas Malthus (1766 - 1834) • Others have argued that human intellect will alter the carrying capacity for humans (inventions, new agricultural technology).
Demography“the study of human populations” • Demographers: analyze trends in population growth using: births, deaths, migration, fertility, life expectancy. • Crude birth rate Crude death rate • “CBR” = “CDR” = • # of births / 1000 # of deaths / 1000 • Global population growth = CBR-CDR/1000 *100 = X% • Sample: Globally, there were 20 births and 8 deaths per 1000 in 2009. What is the growth rate?
To calculate a nation’s population growth rate, migration rate must also be considered. Migration is the movement of individuals from one place to another. • Immigration = into population, Emigration = out of population (CBR + immigration) – (CDR + emigration) *100 1000 [ Sample ] In a particular year, a certain country had a 30 births per 1000 people, but only 15 deaths per 1000. There were 50 immigrants added to the population, but there were only 3 emigrants. Calculate the annual growth rate:
[ Sample ] In a particular year, a certain country had a 30 births per 1000 people, but only 15 deaths per 1000. There were 50 immigrants added to the population, but there were only 3 emigrants. Calculate the annual growth rate (GR): Hey!Lookahere! *(b+i)-(d+e)/10 & (b-d)+(i-e)/10 (CBR + immigration) – (CDR + emigration) *100 1000 (30 + 50) – (15 + 3) *100 1000 (80 - 18) = 62 = .062 1000 1000 1 .062 * 100 = 6.2% GR
Doubling time: The number of years it takes for a population to double at its current rate of growth. Demographers use the Rule of 70 : 70/growth rate Why the number 70? Earth's Human Population Actually happened 2 years earlier (in 2011)
Question of the Day • Calculate the annual growth rate and doubling time for a country with: • 31 Births per 1000 • 15 Deaths per 1000 • 6 Immigrants per 1000 • 2 Emigrants per 1000
Fertility • TFR = Total fertility rate; which is the average number of children that a woman in a particular population will bear between puberty and menopause. (her child-bearing years). • Note that TFR is per woman (not per 1000) • In the U.S. TFR is close to 2
Fertility • Replacement-level fertility (RLF): The TFR required in a population so that the population remains stable. • Typically the Replacement-level needs to be slightly over 2. (to account for instances of pre-reproductive mortality.) • In developed countries – it’s close to 2.1 In developing countries – it’s < 2.1
Fertility • If TFR = RLF (& immigration = emigration) then population is stable. • If TFR is low and there is no significant increase from immigration, then population will decrease. • If TFR is high and there is no significant decrease due to emigration, then population will increase.
Life Expectancy • Life Expectancy (LE) = the average number of years a child born will live (in a particular country.) • LE is generally higher in countries with better healthcare and sanitation. • A high LE in a country also indicates higher material consumption and more severe environmental impacts.
Life Expectancy • Infant and Child Mortality. These rates significantly affect life expectancy. • * • Infant mortality rate = the number of deaths of children under 1 year old per 1000 • Child mortality rate = the number of deaths of children under 5 years old per 1000
Age structure diagrams • Diagrams used to predict population future change in growth rate and size. • The shape of the diagram gives demographers an idea of country’s population situation (current & future). • The diagram is made up of 2 opposing bar graphs. One with male, and one with female population percentages by age group.
Which country’s growth rate is more stable? • Answer: B
QOD - A country with an age structure like the one below will most likely experience: a) a high life expectancy b) very slow population growth c) a short doubling time d) replacement level fertility
Migration • Immigration / Emigration • Regardless of CBR and CDR a country may experience growth, decline, or stability due to migration. • Net migration rate (NMR) = The difference between immigration & emigration / 1000 in a given year • A country of 4.3 million people has a NMR of 2/1000. How many will be added in the next year?
Migration • A country of 4.3 million people has a NMR of 2. How many will be added in the next year? 2x 1000 4,300,000 X = 8600 = 1000x 8,600,000 = 1000x8,600,000 1000 1,000 =
If the global human population is 7.2 billion and is growing at an annual rate of 1.2 %, approximately how many people will be added in the following year? • A) 8.6 x 10⁴ • B) 8.6 x 10⁵ • C) 8.6 x 10⁶ • D) 8.6 x 10⁷ • E) 8.6 x 10⁸
Stage 1 – • a country before modernization. “tribal” “pre-industrial”. High CBR & CDR • High TFR, child & infant mortality rates • Low Life Expectancy • Most of the world moved or moving out of this stage. Some may revert to it due to famine, war, etc..
Stage 2 – • “Transitional” • High CBR, lower CDR • Continued high TFR • Higher life expectancy • Faster population growth (may be exponential)
Stage 3 – • “Industrial” • Lower CBR, lower CDR • Population momentum occurs • Economy & education improves • From farming to industry (fewer children needed per family) • Affluence, birth control, medicine
Stage 4 – • “Post-industrial” • BR can fall below DR • TFR reaches low point (1.2 – 1.5) • Highly affluent, economic development • More elderly (strain on workforce)
Developing vs. Developed • 80% of global population • Higher growth rate • Less education • Less healthcare • Less income • Less sanitation • Less social support • Simple economy • Less ecological footprint • Fewer environmental issues • 20% of global population • Lower growth rate • More education • More healthcare • More income • More sanitation • More social support • Diverse economy • More ecological footprint • More environmental issues
Quiz: • The maximum number of organisms of a species that an ecosystem can support is called __________________. • Who observed that the human population and food supply grew differently? • Why is the global growth rate calculated differently than a country’s growth rate? • If the global CBR is 23 and the global CDR is 6, what is the global growth rate? • A)Calculate the growth rate for a country with CBR of 18, CDR of 8, Immigration rate of 42, and emigration rate of 22. B) What is the country’s doubling time? • Compare/Contrast: Total Fertility Rate & Replacement Level Fertility. • What can you determine about a country with a high life expectancy? • What can you tell about a country with a wide pyramid shaped age-structure diagram? A country with a column shaped age-structure diagram? • A country will likely add how many to its population in the next year if its current population is 24.4 million, and its NMR is 3? • Which stage of the demographic transition would you see a rapid drop in a country’s CDR? • At which stages of the demographic transition are birth rates and death rates similar? • What is population momentum, and when does it usually occur in a demographic transition? • List 3 characteristics of developed nation s which are opposite in developing nations.
The dramatic increase in the human population…….. • …along with increasing standards of living among nations, puts a strain on earth’s natural resources making it difficult to achieve global sustainability. • …was brought on primarily by the Industrial revolution and advances in modern medicine. • …and increasing poverty in developing nations has caused a deficit in adequate food supplies causing a rise in world hunger. Some measures that may counteract this shortage are: - development of new crop species. - improving equity in global food distribution. - converting arable land used primarily for meat production into land for grain production. - providing assistance to countries to help them improve farming and irrigation techniques.
The demographic transition (DT) …….. • Total fertility decreases as countries progress through the DT. • The greatest rate of population growth is in the 2nd (transitional) stage • Population momentum is evident in the 3rd (industrial) stage • The first stage of the DT has high birth and death rates, while the last stage has low birth and death rates. • Age-structure diagrams are used by demographers to help determine which stage of the DT a country is in. Example: an age-structure diagram with a columnar shape would indicate that a country is experiencing slow or no population growth (stable), and that it is most likely in the 4th (post industrial) stage.
Growth models etc… • Exponential growth is growth under ideal conditions, with unlimited resources. When plotted on a graph the increase in number over time looks similar to the letter J (often called a J curve). • Logistic growth is growth that is affected by limiting environmental factors (resources, food, light, water, mates, etc). The logistic model plotted on a graph looks remotely like an S (often called S curve). The growth in the logistic model, being limited, will rise and fall in number. Over time, the average of these ups and downs will be known as the carrying capacity for the organism in its environment (fish in a pond, humans on earth, duckweed in a flask). Carrying capacity is represented by the letter K in population equations. • Biotic potential is the maximum reproductive potential of an organism growing under optimum environmental conditions. (exponential growth) The biotic potential is often restricted by the environment causing a change in growth rate (logistic growth).
r and K strategies: • Each species on earth has a different strategy for ensuring that they leave offspring behind before they die. This strategy is embedded in the genetics of the organism and a deviation from this strategy is uncommon. The 2 extremes of this concept commonly referred to as “r strategists” and “K strategists. • r strategists create a lot of offspring, and few will survive. They mature quickly and reproduce very early in their life. They have a short lifespan and are equipped to make it on their own without parental influence. Examples are bacteria, insects and fish. • K strategists invest time in few offspring (quality over quantity), their young cannot survive on their own until they reach adulthood, they have a long lifespan, they have higher degrees of intelligence since they internalize parental lessons. Examples include elephants, apes, whales, and humans. • All organisms fall somewhere within these 2 extremes