Download
1 / 166
1.66k likes | 1.89k Vues
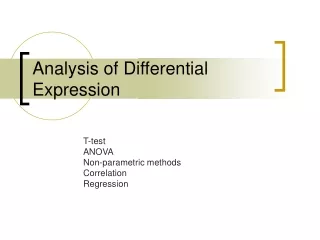
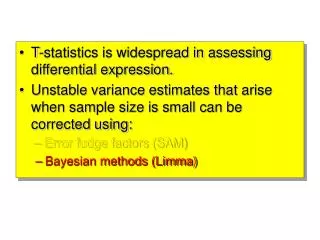
T-statistics is widespread in assessing differential expression. Unstable variance estimates that arise when sample size is small can be corrected using: Error fudge factors (SAM) Bayesian methods (Limma). Limma. Linear model analysis of microarrays. {.

E N D
T-statistics is widespread in assessing differential expression. • Unstable variance estimates that arise when sample size is small can be corrected using: • Error fudge factors (SAM) • Bayesian methods (Limma)
Limma Linear model analysis of microarrays
{ Bayesian regularized t-test(Baldi & Long 2001) The method tries to decouple the mean–variance dependency by modeling the variance of the expression of a gene as a function of the mean expression of the gene My gene The empirical variance is modulated by 0 ‘pseudo-observations’ associated with a background variance 02
Bayesian regularized t-test The main goal of this approach is to stabilize the variance estimates that arise when sample size is small, to make more robust the t-test results
Bayesian regularized t-test The regularized t-test makes more evident the presence of significant differential expressions
BH correction • BH is the most used method for the correction of type I errors in microarray analysis. • However, it has some limitation due to the initial hypotheses: • The gene expressions are independent from each other. • The raw distribution of p values should be uniform in the non significant range.
The application of BH correction to these pvalues will not produce any differential expressed gene!
Let’s identify differentially expressed probe sets by linear modelling To use linear models targets description and raw data will be reorganized on the basis of the number of factors under analysis by Compute Linear Model Fit.
Next step is the definition of the contrasts, which represent the differential expression couples to be considered. If more than two conditions are available more contrasts can be evaluated
Contrast parameterization is saved with a specific name REMEMBER: contrasts represent the different experimental groups (e.g. Treated, Control). Making Treated – Control means that the log(expression) of control samples are subtracted to that of treated samples. The result is the log2(fold change)
A Before evaluating differential expression raw p-value distribution is checked. B C
A If BH correction can be applied to correct type I errors, we can move to the selection of the subset of differentially expressed genes C B
B A
These results can be saved in a new topTable containing only the probe sets shown in red on plots Yes
TopTable structure P-values Average intensity Gene Description Gene Symbol Log-odd statistics Log2 FC T statistics AffyID
Exercise 10 (30 minutes) • Go in the folder estrogen.IGF1. • Create, with excel, a tab delimited file named targets.txt: • Targets file is made of three columns with the following header: • Name • FileName • Target • In column Name place a brief name (e.g. c1, c2, etc) • In column FileName place the name of the corresponding .CEL file • In column Target place the experimental conditions (e.g. control, treatment, etc) • Create a target only for MCF7 and Sker-3 with/without estrogen (E2) treatment. • Calculate Probe set summaries with RMA See next page
Exercise 10 (30 minutes) • In this experiment we have a breast cancer tumor cell line (MCF7) and a tumor cell line derived by central nervous system (SKER3). • Question: • Which are the probe sets controlled by E2 in a tissue independent manner? See next page
Exercise 10 • Calculate intesities with RMA • Filter the data: • IQR 0.25, intensity 25% >100 • Calculate the models for E2 versus untreated cells both in mcf7 and sker3. • Contrasts: mcf7.e2 – mcf7.ctrl sher3.e2 – sker3.ctrl See next page
Exercise 10 • Evaluate if the raw p-value distributions are suitable for BH correction. • Question: • Is the raw p-value distribution good to perfom BH correction? • YES NO See next page
Exercise 10 • Use the “Table of Genes Ranked in order of Differential Expression”. • Plot differentially expressed genes with raw p-value ≤ 0.05 and an absolute fold change ≥ 1 for the two constrast. • Save the subset of the topTables in ex10.mcf7.xls, ex10.sker3.xls • Save the project as ex10.lma
Differential expressions probe set lists generated by affylmGUI or SAM can be compared using Venn Diagrams. A B A max of three files can be compared. Attention: Each file is made by a unique column of probe sets ID without header. Comparison can be performed at probe sets or EG level. C E F D G
Yes The various list subsets will be saved in your working directory
Exercise 11 (15 minutes) • Using "Venn Diagram between probe set lists“, evaluate the level of overlap between the Entrez Genes differentially expressed upon E2 treatment in MCF7 and in SKER3. • Filter the expression data by the genes in common between the two conditions and export the Normalized Expression Values (ex10.common.txt).
Analysis pipe-line Quality control Statistical analysis Filtering Normalization Biological Knowledge extraction Annotation
Annotation • An important issue in microarray data analysis is the specific association of probe identifiers with genome annotated transcripts. • A critical point in annotation is the way in which the association between probes and genes is produced.
Annotation in Affymetrix • NetAffx: Affymetrix annotation repository • Bioconductor: • uses a specific annotation library, AnnBuilder, to create annotation libraries starting from the association probe set identifierGeneBank accession number (i.e. the primary target for probes design). • RESOURCERER (Tsai et al. 2001): • the annotation tool at TIGR center uses EST and gene sequences stored in the TGI databases (www.tigr.org/tdb/tgi.shtml). • They provide an analysis of publicly available EST and gene sequence data for the identification of transcripts and their placement in a genomic context, and the identification of orthologs and paralogs wherever possible. • Neither Bioconductor nor TIGR methods operate at the probe level, nor do they consider the limited reliability of some sets due to probe cross-hybridization or erroneous probe/transcript annotation. • Ensembl: • Annotation with the Ensembl tool is built by direct matching of Affymetrix probes over the Ensembl sequence database. • Its weak point is that matching of only 50% of the probes of a specific set to an Ensembl gene is needed for a true association definition "probe set identifier"/"Ensembl gene identifier".
Ontologies • An ontology is a specification of a conceptualization: • a hierarchical mapping of concepts within a given frame of reference. • An ontology is a restricted structured vocabulary of terms that represent domain knowledge. • An ontology specifies a vocabulary that can be used to exchange queries and assertions. • A commitment to the use of the ontology is an agreement to use the shared vocabulary in a consistent way.
The Gene Ontology • The goal of the Gene Ontology (GO) Consortium is to produce a controlled vocabulary that can be applied to all organisms even as knowledge of gene and protein roles in cells is accumulating and changing. • http://www.geneontology.org/ • For genes and gene products the Gene Ontology Consortium (GO) is an initiative that is designed to address the problem of defining common set of terms and descriptions for basic biological functions. • GO provides a restricted vocabulary as well as clear indications of the relationships between terms.
The Gene Ontology • The Gene Ontology (GO) consortium produces three independent ontologies for gene products. • The three ontologies are: • molecular function of a gene product which is defined to be biochemical activity or action of the gene product (MF 7220). • biological process interpreted as a biological objective to which the gene product contributes (BP 9529). • cellular component is a component of a cell that is part of some larger object or structure (CC 1536).
The Graph Structure of GO • The GO ontologies are structured as directed acyclic graphs (DAGs) that represent a network in which each term may be a child of one or more parents. • GO node is interchangeable with GO term. • Child terms are more specific than their parents: • The term “transmembrane receptor protein-tyrosine kinase” is child of • “transmembrane receptor” and “protein tyrosine kinase”.
The Graph Structure of GO • The relationship between a child and a parent can be characterized by the relations: • is a • has a (part of) • “mitotic chromosome” is a child of “chromosome” and the relationship is an is a relation. • “telomere” is a child of “chromosome” with the has a relation.
GO structure Top node Graph of GO relationships for the term: transcription factor (GO:0003700)
Induced GO graph for a set of diff exprs genes. Top node The induced GO graph colored according to unadjusted hypergeometric p-value0.01 GO can be used to link differentially expressed genes to specific functional classes.
Consider a population of genes representing a diverse set of GO terms shown below as different colors.
Many methods can be used to identify a set of differentially expressed genes
What are the some of the predominant GO terms represented in the set of differentially expressed genes and how should significance be assigned to a discovered GO term?
Example: Population Size: 40 genes Subset of differentially expressed genes: 12 genes 10 genes, shown in light blue, have a common GO term and 8 occur within the set of differentially expressed genes.
Contingency Matrix A 2x2 contingency matrix is typically used to capture the relationships between differentially expressed membership and membership to a GO term.
Subset Contingency Matrix in out 8 2 in GO term 4 26 out
a+b c+d a+c b+d Hypergeometric Distribution The probability of any particular matrix occurring by random selection, given no association between the two variables, is given by the hypergeometric rule.
Assigning Significance to the Findings The HyperGeometric Test permits us to determine if there are non-random associations between the two variables, differential expression membership and membership to a particular Gene Ontology term. Subset in out in p .0002 GO term out ( 2x2 contingency matrix )
EASE(Expression Analysis Systematic Explorer) Hosack et al. Genome Biol., 4:R70-R70.8, 2003. • EASE analysis identifies prevalent biological themes within gene clusters. • The highest-ranking themes derived by a computational method can recapitulate manually derived themes in previously published microarray, proteomics and SAGE results, and to provide evidence that these themes are stable to varying methods of gene selection.
EASE Results • Consider all of the Results • EASE reports all themes represented in a cluster and although some themes may not meet statistical significance it may still be important to note that particular biological roles or pathways are represented in the cluster. • Independently Verify Roles • Once found, biological themes should be • independently verified using annotation resources.
GOstats package • To perform an analysis using the Hypergeometric-based test, one needs to define a gene universe and a list of selected genes from the universe. • To identify the set of expressed genes from a microarray experiment, R. Gentleman (GOstats developer) proposed that a non-specific filter be applied and that the genes that pass the filter be used to form the universe for any subsequent functional analyses.
A In Bioconductor is available a library called GOstat which allows the calculation of enriched GO classes within a set of differentially expressed probe sets. Select the threshold of significance and the GO class of interest. B Select the list of affyIDs representing the differentially expressed probe sets. REMEMBER: the file should contain only the affy ids!!!! C D