Chapter 6 Atmospheric and Oceanic Circulations
430 likes | 828 Vues
Chapter 6 Atmospheric and Oceanic Circulations. Wind is a vector variable Temperature is a scalar variable. Atmospheric and Oceanic Circulations. Wind Essentials Driving Forces within the Atmosphere Atmospheric Patterns of Motion Oceanic Currents . Wind Essentials.

Chapter 6 Atmospheric and Oceanic Circulations
E N D
Presentation Transcript
Wind is a vector variable Temperature is a scalar variable.
Atmospheric and Oceanic Circulations • Wind Essentials • Driving Forces within the Atmosphere • Atmospheric Patterns of Motion • Oceanic Currents
Wind Essentials • Air Pressure and Its Measurement • Mercury barometer • Aneroid barometer • Wind: Description and Measurement • Wind • Anemometer • Wind vane • Global Winds
Barometers Figure 6.2
Air Pressure Readings 1013.25mb=101.325kpa=14.66lb/in2 Figure 6.3
Atmospheric Pressure and Elevation • Which point (p1 vs. p2) has higher air pressure? Why? • How are pressure change with elevation? • Uniformly decrease with elevation • decreases faster with higher close to see level than at high elevations. p2 p1
Wind Vane and Anemometer Wind: horizontal movement of air across Earth surface. Vector: Speed measured by Anemometer Direction measured by wind vane wind direction is defined as the direction from which it originates. Standard measurement of wind is 10 m above ground. Old weather forecast refer wind speed in scales, a commonly used one is Beaufort Wind Scale. Figure 6.4
Driving Forces within the Atmosphere • Pressure Gradient Force • Coriolis Force • Friction Force • Gravity
Pressure Gradient Force Pressure difference is primarily caused by uneven heating of Earth surface Without pressure gradient force, the air will not move, then there will be no Coriolis force, no friction force. Figure 6.7
Coriolis Force It deflects anything that flies or flows across Earth surface: wind, airplane, ocean currents etc. Coriolis Force only changes the direction of movement, not the speed. It is always perpendicular to the direction of movement, to the right hand side on Northern Hemisphere. F=2vΩsin(φ), where v=wind speed, Ω=angular velocity of earth rotation 7.29x10⁵ radians per second, φ=latitude The stronger the wind, the stronger Coriolis force. Figure 6.9
Pressure Gradient Force only Pressure + Coriolis + Friction Pressure Gradient+Coriolis+Friction Forces Pressure Gradient +Coriolis Forces Friction force: Always in the opposite direction of wind. Strength: depending on wind speed, surface condition (topography, vegetation, …) Figure 6.8
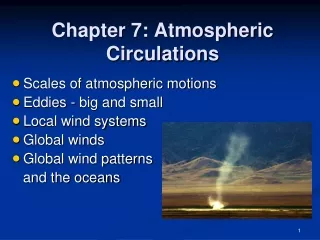
Scales of Atmospheric Movement The movement of atmosphere around the globe is a composite of multiple scale motion, like a meandering river contains larege eddies composed o f smaller eddies containing still smaller eddies. • Macroscale: Large Planetary wide movement of atmosphere, e.g. trade winds, monsoon, hurricanes, which can blow for weeks or longer. • Mesoscale: lasts for several minutes or hours, usually less than 100 km across, e.g. thunderstorms, tornadoes • Microscale: smallest scale of air motion, lasts for seconds at most for minutes, e.g. wind gust, dust devils
The Westerlies tropopause Earth sun 500mb 600mb Pressure gradiant 700mb 800mb 900mb 1000mb N. Pole Equator
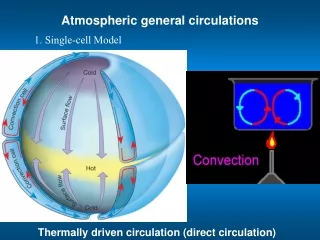
Single Cell Model (Hadley 1735) sun Figure 6.12
Three-Cell Model (1920s) Ferrel Cell Polar Cell Hadley Cell Figure 6.12
General Atmospheric Circulation and pressure zones Figure 6.12
General Atmospheric Circulation Figure 6.12
Primary High-Pressure and Low-Pressure Areas • Equatorial low-pressure trough: thermal • Polar high-pressure cells: thermal • Subtropical high-pressure cells: dynamic • Subpolar low-pressure cells: dynamic
Equatorial Low-Pressure Trough • Intertropical convergence zone (ITCZ) Clouds and rain • Trade winds: The trade winds were named during the era of sail ships that carried trade across the seas.
Global Barometric Pressure Icelandic Low Siberian High Aleutian Low Azores High Hawaiian High The subtropical high pressure zone broke into three high pressure centers: Hawaiian, Azores, Siberian Highs The subpolar low pressure zone broke into two low pressure centers: Aleutian and Icelandic Lows Figure 6.10
High Pressure Center East side drier and more stable, feature cooler ocean currents than west side. Earth major deserts extend to the west coast of each continent.
Global Barometric Pressure Pacific high Bermuda high The high pressure centers are pushed northern. As a result, the subpolar low pressure centers are weakened significantly. Figure 6.10
Westerlies Pacific High Wind Portrait of the Pacific Ocean Trade wind Wind pattern derived from a radar scatterometer aboard Seasat on a day in September. Note: compare wind pattern and the visible earth below: Figure 6.6
June–July ITCZ Figure 6.11
Monsoonal Winds Larger than average northward migration of ITCZ. Regional wind systems seasonally changes direction and intensity associated with changes temperature and precipitation. Winter: cold dry wind blow off the continents Summer: warm moist-laden wind blow from sea toward land Figure 6.20
Upper Atmospheric Circulation • Jet stream: a fast flowing narrow air currents in the upper atmosphere • Rossby waves
Jet Streams An concentrated band of wind occurring in the westerly flow aloft. Flat in vertical direction Speed up to 190 mph Stronger in winter It is caused by the large pressure gradient caused by the large horizontal temperature difference over short distance. Influence surface weather systems. 30-70oN 20-50oN Figure 6.17
Rossby Waves Note: in the upper atmosphere, artic area has low pressure, thus the air circles counterclockwise parallel to the pressure gradient (Why?). But this circle is not perfect. Instead, it follows a wavy path. Discovered by Carl G. Rossby in 1938. It refers to the waving undulations of geostrophic winds of the arctic front. Figure 6.16
Rossby Waves Smooth westward flow of upper air westerlies Develop at the polar front, and form convoluted waves eventually pinch off Primary mechanism for poleward heat transfere Pools of cool air create areas of low pressure Figure 6.16
Local Winds • Land-sea breezes • Mountain-valley breezes • Katabatic winds
Land-Sea Breezes Figure 6.18
Mountain-Valley Breezes Katabatic Wind: A regional scale gravity driven wind, usually needs a high plateau to cool the air, and become dense and flow downslope. Figure 6.19
Oceanic Currents Function: Mixing sea water Surface warm water with deep cold water CO2 absorption Climate Biogeochemical processes: phytoplankton growth Driving force: the frictional drag of winds Thus we have an Atmosphere-Sea are coupled system. Once the current starts to move, the Coriolis force will kick in. Then there is “friction” between upper and lower water, the shear stress.
Major Ocean Surface Currents Surface ocean currents are driven by air circulation around subtropical high pressure cells. Figure 6.21
Equatorial Currents/Western Intesificaitn • Corresponding to trade winds on both sides of the Equator, these winds drives the surface current westward along the equator, called equatorial currents. • The equatorial currents push water piles up against the eastern shores of the continent. This is called western intensification. The piled up water will go either up north or down south . The Gulf Stream is one caused by western intensification.
Upwelling/Downwelling Currents Upwelling Currents: When surface water is swept away from a coast, an upwelling current occurs. This cool water generally is nutrient rich, e.g. Pacific Coast of North and South America Downwelling Currents: Accumulation of surface water (e.g. western end of equatorial current) can gravitates downward to generate a downwelling current. Figure 6.22