Chapter 6 Atmospheric Forces and Wind
840 likes | 1.06k Vues
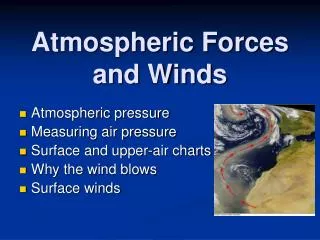
Chapter 6 Atmospheric Forces and Wind. ATMO 1300 SPRING 2010. First…what is wind?. The large-scale motion of air molecules (i.e., not thermal motion). Fig. 6-1, p. 160. Force. Newton’s Second Law of Motion: F = ma Force = mass x acceleration

Chapter 6 Atmospheric Forces and Wind
E N D
Presentation Transcript
Chapter 6Atmospheric Forces and Wind ATMO 1300 SPRING 2010
First…what is wind? • The large-scale motion of air molecules (i.e., not thermal motion)
Force • Newton’s Second Law of Motion: F = ma Force = mass x acceleration • Imbalance of forces causes net motion
Force • Magnitude • Direction
Forces We Will Consider • Gravity • Pressure Gradient Force • Coriolis Force (due to Earth’s rotation) • Centrifugal Force / Centripetal Acceleration • Friction
Gravitational Force • Attraction of two objects to each other • Proportional to mass of objects F = G ( m1 x m2 / r * r ) • For us, gravity works downwards towards Earth’s surface
Pressure Gradient Force • Gradient – the change in a quantity over a distance • Pressure gradient – the change in atmospheric pressure over a distance • Pressure gradient force – the resultant net force due to the change in atmospheric pressure over a distance
Pressure Gradient Force • Sets the air in motion • Directed from high to low pressure • Figure from www.met.tamu.edu/class/ATMO151
Pressure Gradient Force on the Weather Map • H = High pressure (pressure decreases in all directions from center) • L = Low pressure (pressure increases in all directions from center) • The contour lines are called isobars, lines of constant air pressure • Strength of resultant wind is proportional to the isobar spacing • Less spacing = stronger pressure gradient = stronger winds Fig. 6-4, p. 161
A Typical Surface Weather Map Strong P.G. Weak P.G. Weak P.G.
Pressure Measurements • Station Pressure • Sea Level Pressure (SLP) • Station Pressure – the pressure observed at some location. Depends on amount of mass above that location
Pressure Measurements • Sea Level Pressure (SLP) – Station pressure converted to sea level. The pressure measured if the station were at sea level
Why SLP is Important • Pressure change in the vertical is much greater than in the horizontal. • Interested in horizontal pressure changes. • Why?
Horizontal Pressure Change • Horizontal pressure changes cause air to move. That’s why we have wind.
Why SLP is Important • Denver – 5000 ft • Galveston – close to Sea Level Denver Galveston
Why SLP is Important (cont’d) • Pressure decreases 10 mb/100 meters in elevation on average in lower troposphere • Must remove elevation factor to obtain a true picture of the horizontal pressure variations.
Why SLP is Important “Top of Atmosphere” Denver D 5000 Galveston G Sea Level
If Station Pressures Were Used • Lower pressure in mountain areas • Higher pressure in coastal areas • Not a true picture of atmospheric effects L L L H HH
Sea Level Pressure • Must remove the elevation bias in the pressure measurements. • How? • Convert station pressure to sea level pressure • Figure from apollo.lsc.vsc.edu/classes/met130
Converting to SLP • Standard Atmosphere • Rate of vertical pressure change is 10mb/100meters Denver 5000 ft Sea Level
Station Model • Sea Level Pressure is given in millibars. • Figure from ww2010.atmos.uiuc.edu
Surface Weather Map • In terms of pressure observations, all the stations are effectively at sea level.
Why Analyze SLP? (cont’d) • Helps identify the following features: → Low pressure center → High pressure center → Low pressure trough → High pressure ridge
Low Pressure CenterFigure from ww2010.atmos.uiuc.edu • Center of lowest pressure • Pressure increases outward from the low center • Also called a cyclone
High Pressure CenterFigure from ww2010.atmos.uiuc.edu • Center of highest pressure • Pressure decreases outward from the low center • Also called an anticyclone
Low Pressure TroughFigure from www.crh.noaa.gov/lmk/soo/docu/basicwx.htm • An elongated axis of lower pressure • Isobars are curved but not closed as in a low 1000 1004 1008 1012
High Pressure RidgeFigure from www.crh.noaa.gov/lmk/soo/docu/basicwx.htm • An elongated axis of higher pressure • Isobars are curved but not closed as in a high pressure center 1000 1004 1008 1012
Surface Weather MapFigure from www.rap.ucar.edu/weather/model
Temperature & Pressure • Listed to the side are two columns containing air of different temperature • The total number of molecules is identical in each column • At 5 km, will the pressure be higher at Point 1 or Point 2? • Figure from apollo.lsc.vsc.edu/classes/met130
Effect of Temperature on PressureFigure from ww2010.atmos.uiuc.edu
Construction of a 500 mb Mapupper left map from www.srh.noaa.gov/bmx/upperair/radiosnd.html 1 3 2 500 4 500 500 500
Constant Pressure Map • Differences in height of a given pressure value = horizontal pressure gradient • Contour lines connect equal height values. • Contours can be thought of in the same way as isobars on a surface weather map
Pressure variations a constant height surface (e.g., sea level) = Height variations on a constant pressure surface (e.g., 500 mb) L H
Constant Pressure Maps • Standard constant pressure maps: • 200 mb ~ 39,000 ft • 300 mb ~ 30,000 ft • 500 mb ~ 18,000 ft • 700 mb ~ 10,000 ft • 850 mb ~ 5,000 ft
Vertical Pressure Gradient • There is a pressure gradient force directed upward • Pressure gradient force is much larger in the vertical than in the horizontal • Why doesn’t all air get sucked away from the Earth?
Hydrostatic Equilibrium Fig. 6-13, p. 171
Coriolis Force • Due to the rotation of the Earth • Objects appear to be deflected to the right (following the motion) in the Northern Hemisphere • Speed is unaffected, only direction Fig. 6-9, p. 165
Coriolis Force • Magnitude depends on 2 things: Wind speed Latitude • Stronger wind → Stronger Coriolis force • Zero Coriolis force at the equator; maximum at the poles
Coriolis Force (cont’d) • Acts at a right angle to the wind • In the Northern Hemisphere, air is deflected to the right of the direction of motion. • Only changes the direction of moving air, not the wind speed • Only an “apparent” force since we observe from a rotating body (consider motion from space)
Coriolis Force (cont’d) • MYTH: Water drains from a bathtub or sink with a certain rotation due to the Coriolis force. • FACT: Coriolis force is too small to have any noticeable influence on water draining out of a tub or sink. => CORIOLIS WORKS ON LARGE TEMPORAL AND SPATIAL SCALES
Centrifugal Force / Centripetal Acceleration • Due to change in direction of motion • Example: Riding in a car, sharp curve, which direction are you pushed? • OUTWARDS! Your body is still has momentum in the original direction. This “force” is an example of centrifugal force. • Need sharp curvature in flow for this force to be important (examples?)