Understanding Phosphorus Issues in Arkansas: A Comprehensive Overview
420 likes | 547 Vues
This overview delves into the complex Phosphorus issues concerning Arkansas, emphasizing agriculture's pivotal role in regional water quality. It chronicles historical agreements and regulations, highlighting the Arkansas-Oklahoma Compact and subsequent legal efforts addressing nutrient management in poultry operations. The Arkansas P-Index is introduced as a critical tool for assessing phosphorus risk factors in various landscapes. With agriculture comprising a significant portion of the state's economy, understanding these issues is essential to balance economic interests and environmental sustainability.

Understanding Phosphorus Issues in Arkansas: A Comprehensive Overview
E N D
Presentation Transcript
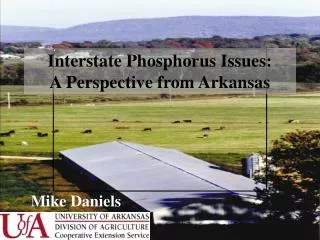
Interstate Phosphorus Issues: A Perspective from Arkansas Mike Daniels
Shaded Relief Map of Arkansas This image can tell us a lot about land use in Arkansas
Total: 3,393 Animal Total: $3,173 (56%) Importance of Animal Agriculture
A Brief History • Arkansas Oklahoma Compact – 1990’s • State Agencies agreed to 40% reduction of P in Illinois River with voluntary efforts • In 1999, Arkansas Poultry Industries request voluntary environmental training for contract growers • Oklahoma passed emergency animal waste regulations in late 1990’s • Restricted litter applications • In 2001, Oklahoma proposes a Phosphorus water quality standard 0.037 mg/l in scenic rivers, of which 6 begin in Arkansas • States begin to negotiate standard to avoid possible legal action • Oklahoma submits standard to EPA
More Recently… • In 2002, City of Tulsa files class action lawsuit against an Arkansas Municipality and 6 Poultry Integrators • Lawsuit Settlement and Consent Decree • No P application in Eucha-Spavinaw basin • Joint P-Index to be developed by UA and OSU by Jan ‘’04 Non-profit agency created to oversee settlement • In 2003, Arkansas passes new regulations for poultry litter and nutrient applications
ACT 1059: Nutrient Management Planner and Applicator Certification • State implements a education, training, and certification program to ensure minimal competence and knowledge of planners • 4 day training and certification test • State implements a education, training, and certification program to ensure minimal competence and knowledge of nutrient applicator in nutrient sensitive areas
ACT 1060: Registration of Poultry Feeding Operations • All poultry operations confining or feeding 2,500 birds on any one day in a 12 month period must register annually ($10 fee). • Items to be reported to ASWCC (Not for public record) • # and kind of houses, location, litter management system, litter storage system, Acreage, application method, amount of litter sold or transferred
ACT 1059: Nutrient Management Planner and Applicator Certification • State implements a education, training, and certification program to ensure minimal competence and knowledge of planners • 4 day training and certification test • State implements a education, training, and certification program to ensure minimal competence and knowledge of nutrient applicator in nutrient sensitive areas
ACT 1061: Proper Nutrient Utilization in Sensitive Watersheds • Nutrients will be applied at protective rates determined by ASWCC • Protective rate is the agronomic or other rate that provides for proper crop utilization, and prevention of significant impacts to waters within the State
ACT 1061: Proper Nutrient Utilization in Sensitive Watersheds • On residential parcels of 2.5 acres or more, nutrients have to be applied by certified nutrient applicator • Poultry operations required to have NMP prepared by certified planner and nutrients applied by certified applicators
P losses from Pastures in runoff is not well understood
Manure P Fertilizer P Soil Test P ?? Runoff Potential Erosion Soil Type Topography Climate Hydrology Land use ???????????????… Phosphorus Delivery to Streams Delivery = function (source & transport)
Arkansas P Index • Developed by USDA and UA researchers • Uses a risk assessment approach to consider many factors to determine manure application rates • Each factor weighted based on their contribution for P movement as determined in research and/or professional judgement.
The Arkansas P Index for Pastures P Index = Source * Transport * Precipitation * BMP
Where Does P in Runoff Water Come From? DeLuane and Moore, 2001. Better Crops. Vol. 85(4):16-20.
Site Characteristic Description Soil Erosion < 1 1 to 2 2 to 3 3 to 5 > 5 0 0.1 0.2 0.4 1 Runoff Class Negligible Low Moderate High Very High 0.1 0.2 0.3 0.5 1.0 Flooding Frequency None Occasional Frequent 0 0.1 2.0 Application Method Incorporated Surface Applied Surface Applied on Frozen Ground or Snow 0.1 0.2 0.5 Application Timing June-Oct March - May Nov – Feb 0.1 0.2 0.3 Grazing Management Hayed Only Grazed and Hayed Grazed Only 0.1 0.2 0.3 P Index Transport Factors P Transport = Sum of Site Characteristic Loss Rating Values Green text represents typical values
Annual Precipitation (in) Weighting Factor 0-10 0.2 10-20 0.4 20-30 0.6 30-40 0.8 40-50 1.0 50-60 1.2 60-70 1.4 Precipitation Factor
P Index Process Farm Conditions/Management Practices P source = (.404 *lb/ac sol P) + (.000666*lb/ac STP) P Transport = Sum of Site Characteristic Loss Rating Values P Index = P Source * P Transport * Precipitation Factor P Index = P Index * 0.9(# BMP) (Putting It All Together)
BMPs Value 0 1.2 0.6 1.8 1 1.1 0.5 1.6 2 1.0 0.5 1.5 3 0.9 0.4 1.3 Influence of BMP to Reduce PI Each BMP Not Included in Source or Transport Is Assumed 10% Effective PI = PI*0.9(# Bmp)
OK Phosphorus Risk Assessment Ratings for Non-Nutrient Limited Watershed
OK Phosphorus Risk Assessment Ratings for Nutrient Limited Watershed
Full Rate – Not to exceed the Nitrogen requirement of the crop and the following P2O5 rates: 1.200 lbs P2O5 per acre when surface applied. 2.300 lbs P2O5 per acre when application is by sprinkler irrigation and managed to prevent runoff from field. 3.400 lbs P2O5 per acre if injected below the soil surface or surface applied and incorporated within 7 days. Half Rate – Not to exceed the Nitrogen requirement of the crop and the following P2O5 rates: 1.100 lbs P2O5 per acre when surface applied. 2.150 lbs P2O5 per acre when application is by sprinkler irrigation and managed to prevent runoff from field. 3.200 lbs P2O5 per acre if injected below the soil surface or surface applied and incorporated within 7 days. Split Application – Not to exceed the Nitrogen requirement of the crop
The Effects of Policy • Regulation 5 (Liquid Wastes) requires CNMP • NRCS has moved to CNMP • National AFO/CAFO Regulations Require Management plan (CNMP) • State regulations may require CNMP for dry manure systems in sensitive watersheds • Under lawsuit Consent Decree, Nutrient Management plans using joint P-Index in Eucha Spavinaw basin
Thank You Questions?