Download
1 / 26
260 likes | 391 Vues
Soil health and microbiological methods for UK soils. by Andrew S. Ball. Introduction. Soil productivity has been severely impaired due to human induced degradation, almost 40% of the worlds agricultural land has been affected.

E N D
Soil health and microbiological methods for UK soils by Andrew S. Ball
Introduction • Soil productivity has been severely impaired due to human induced degradation, almost 40% of the worlds agricultural land has been affected. • In the UK there has been an average decrease of 50% in soil organic matter since 1945. • There is now an increasing awareness of the importance of the soil, in its capacity to function as a productive, stable and sustainable ecosystem. • Micro-organisms have been acknowledged to be ‘the driving force of most terrestrial ecosystems’ (Killham, 1994) and are therefore of vital importance. • As such, the microbial community diversity, abundance, stability and overall structure may be useful indicators of ‘soil health’.
UK Soil health initiative Immediate aims are to: • Generate baseline data for soil profiles. • Compare soil profiles from differing soils under various management regimes. • From this data suggest possible indicators of ‘soil health’.
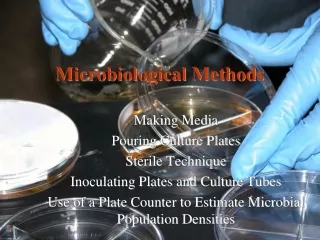
Measurements • Microbiological analyses • total bacterial community analysis using DNA profiling (DGGE) • carbon source utilisation profiling (Biolog). • microbial biomass • culturable bacterial number • total bacterial number
Denaturing gradient gel electrophoresis Soil DNA extraction Increasing chemical denaturant PCR amplification Low GC Amplified double stranded DNA passes through the gel until denaturation takes place. The DNA stops at a point in the gel depending on its GC content. Sequences with higher GC progress further through the gel. High GC
Substrate Utilisation Substrates 1- 31 Substrates 1- 31 Substrates 1- 31 C C C The Biolog ECOplate contains 31 substrates plus one empty control well and a tetrazolium dye. This dye turns purple when oxidised indicates substrate utilisation. The optical density of the plate is recorded at various time points. These data are analysed using multivariate analysis.
Total versus culturable bacterial soil DNA profiles Total Culturable There is little or no overlap betweenthe dominant species from each group. Differences which may be linked to amore rapid response to changes in nutrient status and environmentalfluctuations. The roles of each of these sections of the community require further investigation.
Field Sites • 8 fields on 3 farms were selected for preliminary study • Farm 1:- Ed Cross, loamy sand soil > 1 lucerne/alfalfa (EC2) > 1 oil seed rape (EC3) • Farm 2:- Robert Middleditch, loam and sandy loam soil • 1 pea field (RMA) • 2 sugar beet fields (RMB and RMC) turkey manure applied to RMB • Farm 3:- Robert Carey, silty loam • 1 winter barley (RCA) (due for organic conversion2004) • 1 winter wheat undersown with spring barley and mixed clover (RCC) (organic conversion in 2001) • 1 red and white clover undersown with rye grass (RCD) (year 2 of organic conversion)
Field sampling Ed Cross farm organic sown with Lucerne (EC2) non organic oil seed rape (EC3)
Sampling Regime • RMA chosen for sampling efficiency determination. • select an homogenous field area. • outline a 20 x 20 m grid. • using randomly generatednumbers choose ten points for sampling. • extract a soil core using a 2 cm diameter auger to a depth of 15 cm • generate bacterial DNA profiles for each sample. • pool the 10 samples, homogenise and select 3 sub samples for DNA profiling for comparison and for all other measurements.
Differences in labile nutrient concentrations between the fields Although fluctuations in phosphate concentrations were observed, no clear trend was apparent. Nitrate concentrations were similar except for the fields growing leguminous crops which exhibited elevated concentrations.
Differences in C:N ratios between the fields The C:N ratios were significantly higher in both of the EC fields, greater in EC2 (the organic field but not significant). Larger C:N ratios and lower total bacterial numbers may be indicative of a greater fungal dominance within these fields.
Relationship between total carbon and organic matter content When total carbon content was plotted against organic matter content all groupings were shown to be both farm, and field, specific, except for those belonging to the pea field (RMA). The EC fields again separate from the others lying outside a positive correlation of 0.9.
Differences in bacterial numbers between the fields The total bacterial number present within the soil appeared to be farm specific, both EC fields having significantly lower numbers than the rest. No clear trend was observed for the culturable numbers.
Differences in microbial biomass Carbon between the fields The greatest microbial biomass values were shown in fields with leguminous crops, both organically farmed fields exhibited higher biomass values than their non organic counterparts (not significantly).
Substrate utilisation profiles (Biolog) from all 8 fields 0.30 0.20 0.10 EC 0.00 RM -0.26 -0.24 -0.22 -0.20 -0.18 -0.16 -0.14 -0.12 -0.10 RC PCA Axis 2 (14.9%) -0.10 -0.20 -0.30 -0.40 -0.50 PCA Axis 1 (59.5%) The fields belonging to Ed Cross again separated from all others with a decrease in amino acid utilisation determining this separation, thus confirming the results from the traditional analysis methods.
Silver stained DGGE gel profiling the amplified 16S rDNA bacterial sequences isolated directly from soil EC2 EC3 RMA RMB RMC RCA RCC RCD M M The bacterial community DNA profiles again showed differences between the EC farm, field RMA and the others. Other than these differences there were no treatment differences highlighted and the fields from two geographically distinct farms were almost identical.
0.4 0.3 0.2 EC2 0.1 EC3 RMA 0 RMB -0.4 -0.3 -0.2 -0.1 0 0.1 0.2 0.3 0.4 0.5 -0.1 PCA Axis 2 (7.23%) RMC RCA -0.2 RCC -0.3 RCD -0.4 -0.5 -0.6 -0.7 PCA Axis 1 (78.06 %) Principle component analysis of the 16S rDNA soil bacterial profiles
Silver stained DGGE gel profiling the amplified 16S rRNA bacterial sequences isolated directly from soil . EC2 EC3 RMA RMB RMC RCA RCC RCD M M . * * . . * In addition to the same discrimination observed in the DNA bacterial community profiles, the RNA profiles discriminated the two farms previously showing almost identical profiles. Treatment differences were also observed separating the fields in and nearing organic conversion (RCC and RCD).
0.5 0.4 0.3 EC2 0.2 EC3 0.1 RMA RMB 0 PCA Axis 2 (12.92%) RMC -0.5 -0.4 -0.3 -0.2 -0.1 0 0.1 0.2 0.3 -0.1 RCA RCC -0.2 RCD -0.3 -0.4 -0.5 -0.6 PCA Axis 1 (62.71%) Principle component analysis of the 16S rRNA soil bacterial profiles
Silver stained DGGE gel profiling the amplified 16S rDNA bacterial sequences isolated from the readily culturable members of the soil bacterial community EC2 EC3 RMA RMB RMC RCA RCC RCD M M * * . * * The DNA profiles of the readily culturable community, although variable, again separated the communities from different farms and treatments.
0.5 0.4 EC2 0.3 EC3 0.2 RMA RMB 0.1 RMC 0 PCA Axis 2 (21.34%) RCA -0.5 -0.4 -0.3 -0.2 -0.1 0 0.1 0.2 0.3 0.4 0.5 0.6 -0.1 RCC RCD -0.2 -0.3 -0.4 -0.5 -0.6 PCA Axis 1 (35.92%) Principle component analysis of the 16S rDNA soil culturable bacterial profiles
Conclusions • The bacterial DNA community profiles separated the fields in the same manner as the traditional methods, separating both EC fields and field RMA from the rest. • Despite fluctuations in biomass and nutrient levels, 5 fields from two farms showed almost identical DNA and Biolog profiles. • Soil type was the primary determinant of the composition of the bacterial community in a soil • Culturable and RNA bacterial community profiles again separated the farms but also highlighted treatment differences and so therefore may ultimately be of more use in identifying short term differences between land-use management regimes.
Conclusions continued • Traditional analysis such as total bacterial enumeration and C:N ratios along with Biolog measurements did highlight differences between the Ed Cross farm and the other farms. • A simple correlation between total carbon and organic matter contents showed both farm and field specific trends. Both EC fields were further separated from the others. Field RMA also separated from the other fields within that farm. • Fields growing leguminous crops exhibited the highest nitrate values. • Those fields in organic conversion (EC2 and RCD) did show greater biomass values and higher carbon contents than their non organic counterparts but longer periods of monitoring are required to confirm any underlying trend and identify crop specific trends.
Current Work • examine soil fungal community (DNA and RNA) • investigate effects of fungicides on soil microbial community • compare effects of manure and inorganic fertilisers on microbial activity and diversity • compare microbial profiles across a degradation gradient in soils from Africa, Asia and America
AcknowledgementsMartina GirvanAkin AdetutuSarah YoungMark OsbornJules Pretty