Download
1 / 39
390 likes | 612 Vues
Texas Regional Collaboratives for Excellence in Science and Mathematics Teaching. Program Overview. Carol L. Fletcher, Ph.D. TRC Assistant Director/R&D Coordinator TRC Thirteen Annual Meeting TRC/T-STEM Summit June 27, 2007. TRC - Who We Are.

E N D
Texas Regional Collaboratives for Excellence in Science and Mathematics Teaching Program Overview Carol L. Fletcher, Ph.D. TRC Assistant Director/R&D Coordinator TRC Thirteen Annual Meeting TRC/T-STEM Summit June 27, 2007
TRC - Who We Are • An award-winning statewide network of P-16 partnerships that provide sustained and high intensity professional development to P-12 teachers of science and mathematics. • An infrastructure of over 43 institutions of higher education collaborating with education service centers, school districts, informal science educators and business partners. • A program with a 15-year track record of designing and implementing exemplary science professional development using research-based instructional models, materials, innovative technology, and best practices.
STEM Challenges • Teacher science content knowledge (especially at the elementary level) • Understanding of scientific inquiry • Quality instructional resources aligned to the TEKS • Adequate equipment and materials to implement inquiry lessons • Classroom, planning, and professional development time
Geographic Distribution Regional Collaboratives are located in every Texas Education Service Center region. Amarillo Wichita Falls Lubbock Gainesville Mt. Pleasant Texarkana Denton Irving Richardson Over the 2005-2007 biennium, the TRC is providing professional development to approximately 10,000 teachers of science and 6,000 teachers of math in Grades P–12. Abilene Dallas Fort Worth Kilgore Midland El Paso Waco College Station San Angelo Austin Beaumont Humble San Antonio Houston Victoria Galveston Laredo Corpus Christi 35 Science Regional Collaborative Edinburg 20 Mathematics Regional Collaborative Brownsville
Multiplier Effect 35 Regional Science Collaboratives 1,715 Teacher Leaders High Intensity Professional Development 5,567 Teachers Mentoring and Professional Development Outreach Students Impacted = 473,330 (Based on average of 65 students per teacher) One Year Data: September 2005 - July 2006 (Science)
Statewide Impact 566 School Districts Served 1,689 Campuses Served 7,282 Teachers Served** Data compiled from September 1, 2005 - July 31, 2006 ** 1,715 Teacher Leaders + 5,567 Outreach Teachers = 7,282 Total Teachers
Teachers Mentoring Teachers One Science Teacher Mentor Elementary/Secondary MENTORING IMPACT Cadre Member Cadre Member Cadre Member Cadre Member Cadre Member Students 20-150 Students 20-150 STUDENT IMPACT Students 20-150 Students 20-150 Students 20-150 Total Number of Students Impacted 100 Elementary to 750 Secondary
Educator Demographics - Teaching Level Data based on a sample of 771 teachers for funding period September 2002 - May 2004
Educator Demographics - Teaching Level 2005 - 07 Texas Regional Collaboratives (TRC) professional development priorities as per Texas Education Agency (TEA) guidelines, focused on providing K-8 training on Bridging II TAKS Modules (State endorsed, scientifically researched curriculum), hence increasing the percentage of elementary teachers impacted. Data based on a sample of 6,429 teachers for funding period September 2005 - July 2006
Activities: PDAs and PDPs Professional Development Academies(PDAs) are provided to Instructional Teamsthat consist ofprofessorsof Science and Science Education,ScienceSpecialistsandMaster Teachers.PDAsfocus on the elements of science education reform in Texas. PDAs enhance the knowledge and skills necessary to develop, sustain, and facilitate high quality Professional Development Programs. Professional Development Programs (PDPs) provide an average of105 contact hoursofTEKS-based professional development through Instructional Teams to 25 or more teachers of science per region to prepare and support them to become Science Teacher Mentors (STMs) serving other teachers at the campus, district, and regional levels.
Bridging II TAKS/2005-2007 Every Science Teacher Mentor (STM) across the state receives a minimum of 24 contact hours in Bridging II TAKS Light and Optical Systems. STMs, where appropriate, receive materials to implement the Bridging II TAKS curriculum in their classrooms. STMs build their leadership capacity by mentoring Cadre Members (CMs) in their schools and districts and assisting Instructional Team Members in outreach activities.
PDA Schedule 2006-07 Mark Your Calendar!
Mathematics Regional Collaboratives • TMT3 – Teaching Math TEKS through Technology • MTR – Math TEKS Refinement • MTC – Math TEKS Connections • MAP – Math Achievement Project • MELL – Math for English Language Learners • Twenty Regional Collaboratives for Excellence in Mathematics Teaching • Focused on training in five math modules developed in Texas with TEA support • Activities began July 1, 2006
Program Evaluation – Three Components • TRC program evaluation examines three primary areas of impact: • Teacher Science Content Knowledge • Teacher Practice • Student Achievement
Program Evaluation – Three Components • Component #1 • Teacher science content • knowledge
Impact on Teachers: Science Content Knowledge Data represents combined mean scores of 12 different assessments, 8 Regional Collaborative Sites, and approximately 250 teachers.
Statewide Impact on Teachers: Science Content Knowledge Summary of 21 different tests of science content knowledge administered to classroom teachers. Test content covered a range of topics including physics, chemistry, biology, earth science, and science process skills.
Impact on Teachers: Physics Content Knowledge Summary of results from a pre test and post test given to Instructional Team Members (ITMS) before and after training in a professional development module on Integrated Physics and Chemistry. ITMs were then responsible for training STMs in their respective Regional Collaboratives.
Program Evaluation – Three Components • Component #2 • Teacher practice
Impact on Instructional Team Members (ITMs) • Bridging II TAKS** training significantly improved the statewide leadership capacity of ITMs to deliver professional development to science teachers in Bridging II TAKS Module 2: Using Tools to Explore Matter. • 37 ITMs participated in three days of professional development on Bridging II TAKS to enhance their effectiveness to deliver professional development to science teachers in the field. • ITMs rated their degree of preparation to deliver the Bridging II TAKS module in a 19-item pre and post-survey. Statistically significant improvements were noted. • ** Bridging II TAKS Modules are State endorsed, scientifically researched material based on team/cooperative learning using the 5-E Instructional Model (Engage, Explore, Explain, Elaborate, Evaluate) Response Categories 1 = Not Adequately Prepared 2 = Somewhat Prepared 3 = Fairly Well Prepared 4 = Very Well Prepared
Impact on Science Teacher Mentors (STMs) • Thirty-two contact hours of Bridging II TAKS training were provided statewide to 389 STMs. • STMs rated their degree of preparation to deliver the Bridging II TAKS module to their colleagues in the field in a 19-item pre and post-survey. Statistically significant improvements were noted. • Post-survey data showed that participating STMs were significantly more prepared to share the professional development provided with their fellow classroom teachers referred to as Cadre Members (CMs). Response Categories 1 = Not Adequately Prepared 2 = Somewhat Prepared 3 = Fairly Well Prepared 4 = Very Well Prepared
Impact on Cadre Members (CMs) Based on data collected from a sample of 403 elementary science teachers trained in Bridging II TAKS curriculum during 2004-05.
Impact on Science Teacher Mentors (STMs) Based on data collected from a sample of 493 K-8 science teachers trained in Bridging II TAKS curriculum during 2005-06.
Impact on Cadre Members (CMs) Based on data collected from a sample of 831 K-8 science teachers trained in Bridging II TAKS curriculum during the 2005-06 project year.
Program Evaluation – Three Components • Component #3 • Student • Achievement
Poverty Levels of Participant Schools Poverty Levels for public schools are determined by the percentage of students who receive free or reduced lunches. Percentages based on a sample of 4,399 teachers who provided campus poverty level data from September 2005 – July 2006.
Title I Status of Participating Campuses 21% 79% Based on a sample of 6,450 Teachers reporting campus Title I status from September 2005 - July 2006
Ethnicity of Students Served by Collaborative Teachers 1% 1% 1% 12% 51% 34% Based on actual classroom data reported by a sample of 1157 teachers from September 2004 - May 2005.
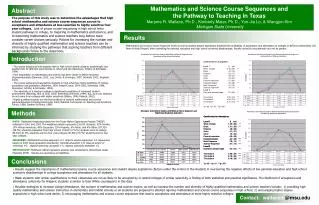
Statewide Student Achievement Gain: Comparative Data Data compares percentage of students who met the state passing standard on the Elementary Science TAKS administered at Grade 5 in Texas.
Student Achievement Gain/A Regional Snapshot-Region 7 Students of TRC teachers exceed students of non-TRC teachers both in percentages that meet the state standard for passing the TAKS and in the percentage that score at the Commended Level (90% correct).
Statewide Student Achievement Gain: Longitudinal Data Elementary Science State Test/Texas Assessment of Knowledge and Skills (TAKS) A Three-Year Analysis (2002-05)
Student Achievement Gain/A Multi-Grade Regional Snapshot-East Texas
District-Specific Student Achievement Gain - Aldine ISD Students in the Aldine Independent School District (ISD) taught by teachers in the Rice University Regional Collaborative showed significant improvement as compared to non-participant teachers in the same school district on a test consisting of items from the Third International Math and Science Study (TIMSS) and released TAAS tests. Rice University Regional Collaborative
District-Specific Student Achievement Gain - Austin ISD CLOSING THE GAP: 25 Austin Independent School District (AISD) schools that received intervention through the support of the TRC and Advanced Micro Devices (AMD) posted significantly greater gains on the elementary TAKS test than other AISD schools. TRC support contributed to closing the gap in achievement between these high poverty, high minority schools and the rest of the district.
District-Specific Student Achievement Gain - Galveston ISD TRC Intervention CLOSING THE GAP: Galveston Independent School District (GISD) campuses that were selected to participate in the TRC/Rockwell program improved an average of 22 points each year between 2003 to 2004 and 2004 to 2005. In contrast, other GISD campuses improved 46 and 52 points during this same time period. After TRC intervention, TRC campuses showed an average improvement of 51 points, catching up with their comparison campuses who improved an average of 47 points during this same time period.
District-Specific Student Achievement Gain – Round Rock ISD Relationship between Bridging II TAKS curriculum and Elementary TAKS/State Tests (2004-2005) Improvement on Elementary TAKS passing rates and commended rates from 2004 to 2005 was positively related to implementation of Bridging II TAKS lessons in Round Rock ISD schools that participated in the Austin Community College Regional Collaborative.
Contact Information www.theTRC.org • Kamil A. Jbeily, Ph.D.Executive DirectorTexas Regional Collaboratives512-471-9460 kjbeily@mail.utexas.edu • Carol L. Fletcher, Ph.D.Assistant Director/R&D Coordinator Texas Regional Collaboratives 512-232-5690 carol.fletcher@mail.utexas.edu • Mary Hobbs, Ph.D. Coordinator for Science Initiatives Texas Regional Collaboratives512-471-8729 maryhobbs@mail.utexas.edu