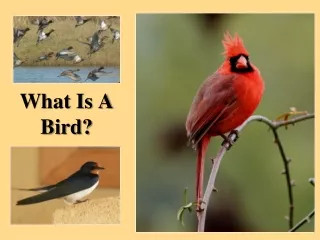
A Model for Predicting Bird Abundance
150 likes | 268 Vues
This study presents a dynamic model for predicting bird abundance based on riparian habitat characteristics, aimed at enhancing adaptive management strategies and evaluating bank rehabilitation site designs. By analyzing bird abundance patterns and various vegetative metrics, including species composition and patch size, we examine how these factors influence bird populations over time and across different riparian rehabilitation sites. The model’s applicability can guide effective monitoring and habitat restoration projects, ensuring the resilience and sustainability of avian communities.

A Model for Predicting Bird Abundance
E N D
Presentation Transcript
A Model for Predicting Bird Abundance • Adaptive Management • Bank Rehabilitation Site Design • Effectiveness Monitoring -- Meeting Program Objectives?
OBJECTIVES • Use Bird abundance patterns and Riparian characteristics • Predict bird abundance following construction and as riparian habitat develops -- Rehabilitation sites -- Program area
Flow level Area of Disturbance Food availability Heterogeneity Emmigration Bird metrics t Abundance Density Productivity Bird metrics t+1 Abundance Density Productivity Construction Disturbance Replanting Riparian removal Veg metrics t Veg Class / Association Veg metricst+1 Veg Class / Association Side channel formation Timing Flow level Wildlife Model For Bird Response Habitat Arrangement Bird Behavior Restoration Hydrograph t+1 Hydrograph t Unit t Study area Rehab site Reach Unit t+1 Study area Rehab site Reach I II III Time
Riparian Mapping and Inventory McBain and Trush, Redwood Sciences Laboratory
Most Abundant Vegetation Types used for Regression Tree Model • White Alder • Narrowleaf Willow • Mixed Willow • Black Cottonwood • Mixed conifer – White Oak • Himalaya Berry • Calif. Grape • Canyon Live Oak • Grasses
Variables for our Regression Tree Example • Vegetation Type • River Mile • Patch Size • Vegetation Type within 200 m of each Survey Station
YELLOW WARBLER | 0.95 Vegetation Type White Alder- Narrow Willow - Black Cottonwood - Willow-Oak-Pines n=67 n=243 0.49 1.08 0.13 0.63 Veg. Type River Mile > 89 River Mile < 89 n=115 n=128 River Mi. > 83 River Mi.< 83 0.82 1.30 River Mi. > 105 River Mi. < 105 0.97 0.63 1.17 1.62 0.78 1.30 River Mi. > 90 River Mi. <90 Patch Size < .07 > 2.00 1.30 < 108 > River Mi. 2.10 1.10 1.20 0.72 1.30 0.40 1.10 0.07 Various Veg. Types
Predicting Yellow Warbler Abundance Patch Veg. Assoc. RvrMi Pred x SE
How Many Yellow Warblers in the Study Area? Predicted Mean/ Survey Area = Density; Density X Patch Area = Predicted Number of YWAR Total Predicted Number for All Patches = Estimated Population
SONG SPARROW | 1.30 Vegetation Type White Alder- Narrow Willow - Black Cottonwood - Willow-Oak-Pines n=274 n=37 0.71 1.40 River Mile < 90 River Mile > 90 1.20 1.60 Veg. Type River Mile 1.14 1.80 1.60 2.50 River Mile Patch Size 0.92 1.30 Patch Size 1.80 1.40 1.50 0.90 2.40 1.70 1.20 1.80 0.90 1.90 0.77 1.60 Various Vegetation Types