Automated Image Processing
The MRI Study of Normal Brain Development. ANXIOUS-DEPRESSED SYMPTOMS QUALIFY THE RELATION BETWEEN CEREBRAL CORTICAL STRUCTURE AND AGGRESSIVE BEHAVIOR IN TYPICALLY DEVELOPING YOUTHS.

Automated Image Processing
E N D
Presentation Transcript
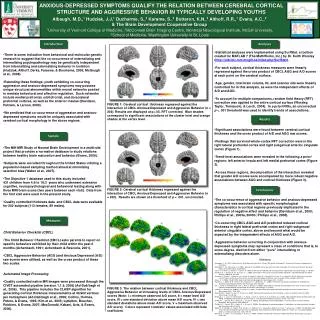
The MRI Study of Normal Brain Development ANXIOUS-DEPRESSED SYMPTOMS QUALIFY THE RELATION BETWEEN CEREBRAL CORTICAL STRUCTURE AND AGGRESSIVE BEHAVIOR IN TYPICALLY DEVELOPING YOUTHS Albaugh, M.D.,1Hudziak, J.J,1Ducharme, S.,2Karama, S.,2Botteron, K.N.,3Althoff, R.R.,1 Evans, A.C.,2 & The Brain Development Cooperative Group 1University of Vermont College of Medicine, 2McConnell Brain Imaging Centre, Montreal Neurological Institute, McGill University, 3School of Medicine, Washington University in St. Louis Introduction Analyses • There is some indication from behavioral and molecular genetic research to suggest that the co-occurrence of externalizing and internalizing psychopathology may be genetically independent from internalizing and externalizing behavior in isolation (Hudziak, Althoff, Derks, Faraone, & Boomsma, 2005; McGough et al., 2008). • Extending these findings, youth exhibiting co-occurring aggression and anxious-depressed symptoms may possess unique structural abnormalities within neural networks posited to mediate behavioral and affective regulation. Such networks include medial prefrontal, orbitofrontal, and dorsolateral prefrontal cortices, as well as the anterior insulae (Davidson, Putnam, & Larson, 2000). • We predicted that co-occurrence of aggression and anxious-depressed symptoms would be uniquely associated with cerebral cortical morphology in the above regions. • Statistical analyses were implemented using SurfStat, a toolbox created for MATLAB 7 (The MathWorks, Inc.) by Dr. Keith Worsley (http://wiki.bic.mni.mcgill.ca/index.php/SurfStat). • For each subject, cortical thickness measures were linearly regressed against the cross product of CBCL AGG and A/D scores at each point on the cerebral surface. • Age, gender, total brain volume, IQ, and scanner site were linearly controlled forin this analysis, as were the independent effects of A/D and AGG. • To account for multiple comparisons, random field theory (RFT) correction was applied to the entire cortical surface (Worsley, Taylor, Tomaiuolo, & Lerch, 2004). In a priori ROIs, an uncorrected p <. 001 threshold was used to identify trends of associations. FIGURE 1: Cerebral cortical thickness regressed against the interaction of CBCL Anxious/Depressed and Aggressive Behavior (n = 202). Results are displayed at p<.05, RFT corrected. Blue shades correspond to significant associations at the cluster level and orange shades at the vertex level. Results • Significant associations were found between cerebral cortical thickness and the cross product of A/D and AGGraw scores. • Findings that survived whole-cortex RFT correction were in the right lateral prefrontal cortex and right subgenual anterior cingulate cortex (Figure 1). • Trend-level associations were revealed in the following a priori regions: left anterior insula and left medial prefrontal cortex (Figure 2). • Across these regions, decomposition of the interaction revealed that greater A/D scores were accompanied by more robust negative associations between AGG and cortical thickness (Figure 3). Sample • The NIH MRI Study of Normal Brain Development is a multi-site project that provides a normative database to study relations between healthy brain maturation and behavior (Evans, 2006). • Subjects were recruited throughout the United States utilizing a population-based sampling method aimed at minimizing selection bias (Waber et al., 2007). • The Objective 1 database used in this study included 431children from 4:6 to 18:3 years who underwent extensive cognitive, neuropsychological and behavioral testing along with three MRI brain scans (two years between each visit). Data from the first visit were used in the present study. • Quality controlled thickness data and CBCL data were available for 202 subjects (113 females, 89 males). Conclusions FIGURE 2: Cerebral cortical thickness regressed against the interaction of CBCL Anxious/Depressed and Aggressive Behavior (n = 202). Results are shown at a threshold of p < .001, uncorrected. • The co-occurrence of aggressive behavior and anxious-depressed symptoms was associated with specific morphological characteristics in cortical regions previously implicated in the regulation of negative affect and behavior (Davidson et al., 2000; Phillips et al., 2003a, 2003b; Phillips et al., 2008). • Co-occurring CBCL AGG and A/D predicted reduced cortical thickness in right lateral prefrontal cortex and right subgenual anterior cingulate cortex, above and beyond what would be expected by the independent effects of AGG and A/D. • Aggressive behavior occurring in conjunction with anxious-depressed symptoms may represent a class of conditions that is, to some degree, distinct from either “pure” internalizing or externalizing disorders alone. Measures • Child Behavior Checklist (CBCL) • The Child Behavior Checklist (CBCL) asks parents to report on specific behaviors exhibited by their child within the past 6 months (Achenbach, 1991; Achenbach & Rescorla, 2001). • CBCL Aggressive Behavior (AGG )and Anxious/Depressed (A/D) raw scores were utilized, as well as the cross product of these two scales. References Achenbach, T. M. (1991). Manual for the Child Behavior Checklist 4–18 and 1991 profile. Burlington VT: University of Vermont, Department of Psychiatry. Achenbach, T. M., & Rescorla, L. A. (2001). Manual for the ASEBA school-age forms & profiles. Burlington VT: University of Vermont, Research Center for Children,Youth, and Families. Collins, D., Holmes, C., Peters, T., & Evans, A. (1995). Automatic 3D model-based neuroanatomical segmentation. Hum Brain Mapp, 3, 190-208. Davidson, R. J., Putnam, K. M., & Larson, C. L. (2000). Dysfunction in the neural circuitry of emotion regulation--a possible prelude to violence. Science, 289(5479), 591-594. Ducharme, S., Hudziak, J. J., Botteron, K. N., Ganjavi, H., Lepage, C., Collins, D. L., Albaugh, M. D., Evans, A. C., & Karama, S. (2011). Right anteriorcingulate cortical thickness and bilateralstriatal volume correlatewith CBCL AggressiveBehavior scores in healthychildren. BiologicalPsychiatry. Evans, A. C. (2006). The NIH MRI study of normal brain development. Neuroimage, 30(1), 184-202. Hudziak, J. J., Althoff, R. R., Derks, E. M., Faraone, S. V., & Boomsma, D. I. (2005). Prevalence and genetic architecture of Child Behavior Checklist-juvenile bipolar disorder. Biol Psychiatry, 58(7), 562-568. Kim, J., Singh, V., MacDonald, D., Lee, J., Kim, S., & Evans, A. (2005). Automated 3D extraction and evaluation of the outer cortical surface using a Laplacian map and partial volume effect classification. NeuroImage, 27, 210-221. Lyttelton, O., Boucher, M., Robbins, S., & Evans, A. (2007). An unbiased iterative group registration template for cortical surface analysis. NeuroImage, 34(4), 1535-1544. MacDonald, D., Kabani, N., Avis, D., & Evans, A. (2000). Automated 3D extraction of inner and outer surfaces of cerebral cortex from MRI. NeuroImage, 13, 340-356. McGough, J. J., Loo, S. K., McCracken, J. T., Dang, J., Clark, S., Nelson, S. F., & Smalley, S. L. (2008). CBCL pediatric bipolar disorder profile and ADHD: comorbidity and quantitative trait loci analysis. J Am Acad Child Adolesc Psychiatry, 47(10), 1151-1157. Phillips, M. L., Drevets, W. C., Rauch, S. L., & Lane, R. (2003a). Neurobiology of emotion perception I: The neural basis of normal emotion perception. Biol Psychiatry, 54(5), 504-514. Phillips, M. L., Drevets, W. C., Rauch, S. L., & Lane, R. (2003b). Neurobiology of emotion perception II: Implications for major psychiatric disorders. Biol Psychiatry, 54(5), 515-528. Waber, D. P., De Moor, C., Forbes, P. W., Almli, C. R., Botteron, K. N., Leonard, G., Milovan, D., Paus, T., & Rumsey, J. (2007). The NIH MRI study of normal brain development: performance of a population based sample of healthy children aged 6 to 18 years on a neuropsychological battery. J IntNeuropsychol Soc, 13(5), 729-746. Worsley, K. J., Taylor, J. E., Tomaiuolo, F., & Lerch, J. (2004). Unified univariate and multivariate random field theory. Neuroimage, 23 Suppl 1, S189-195. • Automated Image Processing • Quality controlled native MR images were processed through the CIVET automated pipeline (version 1.1.9, 2006) (Ad-Dab'bagh et al., 2006). This pipeline includes the CLASP algorithm for generating cortical thicknessmeasurements at 40,962 vertices per hemisphere (Ad-Dab'bagh et al., 2006; Collins, Holmes, Peters, & Evans, 1995; Kim et al., 2005; Lyttelton, Boucher, Robbins, & Evans, 2007; MacDonald, Kabani, Avis, & Evans, 2000). FIGURE 3: The relation between cortical thickness and CBCL Aggressive Behavior at increasing levels of CBCL Anxious/Depressed scores (Note: I = minimum observed A/D score, II = mean level A/D score, III = one standard deviation above mean A/D score, IV = two standard deviations above mean A/D score, V = maximum observed A/D score). Colors represent t-statistic values associated with beta coefficient.