The Global Climate Perspective
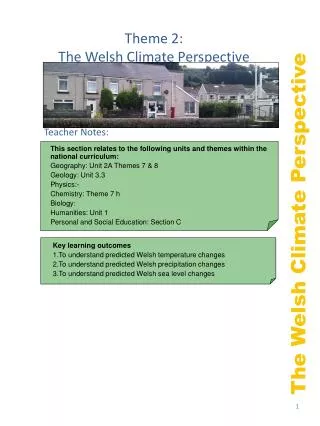
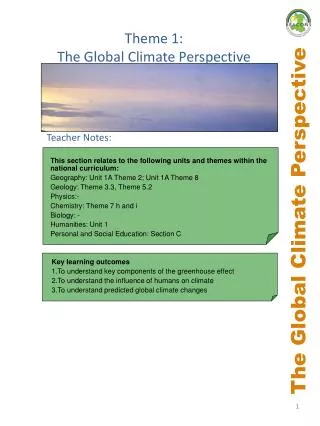
Theme 1: The Global Climate Perspective. Teacher Notes:. This section relates to the following units and themes within the national curriculum: Geography: Unit 1A Theme 2; Unit 1A Theme 8 Geology: Theme 3.3, Theme 5.2 Physics:- Chemistry: Theme 7 h and i Biology: - Humanities: Unit 1

The Global Climate Perspective
E N D
Presentation Transcript
Theme 1: The Global Climate Perspective Teacher Notes: This section relates to the following units and themes within the national curriculum: Geography: Unit 1A Theme 2; Unit 1A Theme 8 Geology: Theme 3.3, Theme 5.2 Physics:- Chemistry: Theme 7 h and i Biology: - Humanities: Unit 1 Personal and Social Education: Section C The Global Climate Perspective Key learning outcomes To understand key components of the greenhouse effect To understand the influence of humans on climate To understand predicted global climate changes
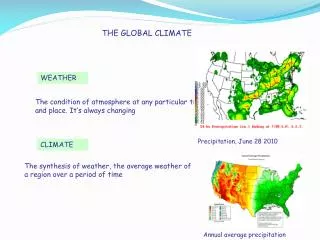
Pupil Notes The climate of the world is continually changing. In the past, this has been a result of natural factors such as volcanic eruptions, changes to ocean currents, planet Earth’s orbital changes and solar variation. More recently, scientific and media debate on the issue of global warming has focussed on the role of human activities, in particular the release of greenhouse gases such as carbon dioxide and methane. This section of the education pack will explore processes involved in climate change and consequences at a global level for temperature, precipitation and sea level. Principle of the “Greenhouse Effect” Figure 3. Global Carbon Dioxide Levels The sun shines down on the surface of the earth. About half the heat naturally reflects back out into space. When greenhouse gases such as carbon dioxide and methane are released into our atmosphere, they trap heat and stop it reflecting back out into space. This causes additional warming of the earth surface, ocean and atmosphere… just like a greenhouse! The Global Climate Perspective Source: http://www.ipcc.ch/publications_and_data/ar4/syr/en/mains2-2.html Figure 2. The Greenhouse Effect Levels of carbon dioxide in the atmosphere significantly increased around 1900. This co-incided with the Industrial Revolution. At this time, levels rose from about 250 parts per million to more than 375 parts per million. Did you know? The Greenhouse effect keeps our planet warm enough for life. Source: www. global-greenhouse-warming.com Did you know? Carbon dioxide is released into the atmosphere from volcanic eruptions and burning fossil fuels such as coal, oil and gas. However, most methane gas is produced by cattle!
December, January, February (UK Winter) June, July, August (UK Summer) What Could Our Future Planet Look Like? Temperature and Precipitation Figure 4. Predicted Temperature Changes in 2029 and 2099 (Compared with 1999 Figures) Low level of greenhouse gas emissions Did you know? It is very difficult to predict the amount of greenhouse gases we are likely to release in the future. The greater the amount released, the higher the predicted temperatures. Medium level of greenhouse gas emissions High level of greenhouse gas emissions Source:http://www.ipcc.ch/publications_and_data/ar4/wg1/en/figure-spm-6.html Assuming a medium level of greenhouse gas emissions, Northern latitudes are expected to warm most rapidly. By 2099, it is expected that the North Pole could have warmed by 7oC and areas around the equator could have warmed by around 3.5oC. The Global Climate Perspective Figure 5. Precipitation Changes by 2099 (Compared with 1999 Figures) Source: http://www.ipcc.ch/publications_and_data/ar4/wg1/en/figure-spm-7.html Assuming medium levels of greenhouse gas emissions, precipitation in the form of rain, snow, sleet and hail is expected to increase by up to 20% in many Northern areas during the months of December, January and February. However, significant decreases of up to 20% are expected for areas such as North East Africa and Central America. Reductions in precipitation of up to 20% are expected during the months of June, July and August across much of Europe and Africa.
Sea Level Change Global average sea level rose by approximately 120m after the last Ice Age (21,000 years ago), but stabilized at its present position around 2000 years ago. Average global sea level is currently rising, although there are regional variations, depending on rates of ocean warming, quantity of melting ice, and rates of land rise after the last glaciation, among other factors. Water Expansion- Water expands as it warms up. This is thought by scientists to be the most dominant factor (>50%) in sea level change. Melting Ice- The second most important factor is melting land ice. Water in glaciers and ice sheets has often been trapped as ice for tens of thousands of years. When land based glaciers and ice sheets melt, water flows into the sea and sea level rises. Figure 7. Global Sea Level Change Since 1955 Figure 6. Global Sea Level Rise by 2100 (Assuming Medium Emissions) The Global Climate Perspective Source: http://www.ipcc.ch/publications_and_data/ar4/wg1/en/figure-5-20.html Source: http://www.ipcc.ch/publications_and_data/ar4/wg1/en/faq-5-1-figure-1.html How Much? Global average sea levels have risen by 15cm in the last 100 years. Levels could increase by another 50cm in the next 100 years. Did you know? Most of the world’s major cities lie less than 1m above sea level??? Myth Alert!!! Icebergs and other types of sea ice do not cause sea level rise when they melt. Ice floats because it is less dense than water. When ice melts in a drink on a hot day, the glass does not overflow. In the same way, melting sea ice does not cause sea level rise.
Activities • (Geography Unit 1A, Theme 2) Run the simulation at http://www.ngfl-cymru.org.uk/eng/cc-greenhouse-effect-mainpage/cc-greenhouse-effect.htm. What is the greenhouse effect and how have people’s actions affected this process? • . • (Geography Unit 1A, Theme 2) Look at figures 4 and 5. What would the possible effects of climate change be in More Economically Developed Countries. Compare these with the impacts on Less Economically Developed Countries. Which is likely to be most severely affected and why? • (Geography Unit 1A, Theme 8) Look at figures 4 and 5. How do weather hazards across the world affect people, the economy and the environment? • (Geology, Theme 3.3) Using the internet, maps and aerial images, investigate the evidence for past and current fluctuations in continental ice and the effect on global sea levels. • (Geology, Theme 5.2) Investigate the media coverage of extreme weather events in the last 6 months and write a news article to summarise your findings. • (Chemistry Theme 7, Humanities Unit 1) Research some of the solutions to global warming such as carbon capture and trading. What are the advantages and disadvantages of each? • Poles Apart – an experiment to investigate how melting ice and snow affects sea levels available from: http://www.csiro.au/resources/poles-apart-activity.html Conduct the experiment and then answer the following questions: • a) What happens to the level of water in each glass? • b) Explain why there is a difference between the rise in water level in each glass? • c) How do the results relate to the impacts of melting icebergs in the Arctic? (Geography Unit 1A, Theme 2; Humanities Unit 1) Watch this short video by David Attenborough about the science of climate change (3 minutes): http://www.youtube.com/watch?v=S9ob9WdbXx0. How conclusive is the range of evidence for human-induced climate change and what might cause uncertainty? The Global Climate Perspective
References http://www.ipcc.ch- Graphics, maps and data sets to demonstrate principles of climate change, global temperature and sea level changes plus much more. http://www.ipcc.ch/publications_and_data/ar4/syr/en/mains3-3-2.html- Facts and figures on impacts of climate change for world regions http://www.ngfl-cymru.org.uk/eng/cc-greenhouse-effect-mainpage/cc-greenhouse-effect.htm- An interactive schematic model demonstrating the greenhouse effect http://www.csiro.au/resources/poles-apart-activity.html Poles apart – An experiment to investigate how melting ice and snow affects sea levels http://www.youtube.com/watch?v=S9ob9WdbXx0- A video clip of David Attenborough exploring the link between carbon dioxide and climate change http://sciencecases.lib.buffalo.edu/cs/collection/detail.asp?case_id=479&id=479 - Role play game of an intern advising a US Senator The Global Climate Perspective