RAIL NETWORK CAPACITY ISSUES
This report by Ray Kinnear and Simon Lane from the Department of Transport analyzes the significant growth in public transport patronage that exceeds previous forecasts, particularly concerning train services. It identifies factors contributing to this surge, including population dynamics, employment growth, and shifts in market strategies. The findings suggest that growth is driven by increased market share from public transport against private vehicle usage, influenced by variables like fuel prices, parking costs, and service quality. Future growth predictions highlight an ongoing challenge for railway capacity management.

RAIL NETWORK CAPACITY ISSUES
E N D
Presentation Transcript
RAIL NETWORK CAPACITY ISSUES Ray Kinnear and Simon lane Department of Transport 12 June 2008
Patronage growth is significantly exceeding the existing forecasts - particularly for trains Source: Official Patronage Series (March 2008)
Patronage growth is the result of changes in the “size of the market” and changes in “PT’s share of the market” Public transport patronage A. Size of market B. Public transport share of market The size of the pie The share of the pie
Components of Population include: absolute change, location and age structure Public transport patronage A. Size of market B. Public transport share of market A1. Population A2. Employment A3. Trip rates Absolute change Location Age
Population growth was greater than predicted in some middle and inner LGAs (with a couple of exceptions) and less than predicted in some fringe LGAs. These LGAs had greater growth than predicted by VIF (2004) ERP less VIF These LGAs had less growth than predicted by VIF (2004) Source: Victoria in Future (VIF), DSE/DPCD (2004) and Estimated Residential Population (ERP) from 2006 Census
CBD job growth is a dominant employment-related driver of public transport use and has been particularly strong in the past three years. Three of the biggest four growth years in the last decade have been in the last three years There is no evidence that other employment changes, such as increases in part-time employment, have impacted on public transport patronage Source: Census of Land Use and Employment (CLUE) Melbourne City Council (2006)
The second half of the story…the increasing share of trips that PT may be gaining from other modes, such as private vehicles Public transport patronage A. Size of market B. Public transport share of market ? A1. Population A2. Employment A3. Trip rates
Market research has identified six main potential drivers of change impacting on public transport’s “share of the market”… plus “other” Public transport patronage A. Size of market B. Public transport share of market A1. Population A2. Employment A3. Trip rates B2.Fuel prices B3. Parking prices B1. Service provision B4. Congestion B5. Service quality B7. Other (not easily factored into the model) B6. Fares
27% of people indicated they had reduced their car usage. Cost issues were the most important reason for reduced car use, but others were also mentioned Stated reasons for reduced vehicle usage (2006) Petrol price was by far the number one stated reason for reduced vehicle usage in 2006. Cost issues (shaded) were three of the top five reasons. Source: LEK Market Segmentation Study (2006)
Factors affecting patronage growth in Melbourne (2002 - 2007) 180,000 160,000 Other Congestion factors 140,000 CBD parking costs 120,000 Petrol 100,000 prices Congestion Other factors 80,000 CBD parking costs CBD Petrol prices jobs 60,000 Service provision CBD jobs 40,000 Petrol prices Service Population Population provision growth 20,000 Population growth growth 0 Train Tram Bus PT fares Other factors -20,000 Service quality The patronage growth can be explained through known drivers of public transport growth – but some growth (‘white space’) is unexplained for train in particular Cabinet in Confidence
Patronage forecasts can be estimated based on estimated values of the key factors - low, medium and high values have been used
Using these explanatory factors as a framework, predictions have been made for future growth for train (7.9% p.a), tram (4.2% p.a) and bus (3.5% p.a) Growth predictions by mode given low, medium and high estimates on the key factors in the model – Melbourne Public Transport
A tapering of growth rates is expected to impact the market, particularly in 10 years time 5.3% 7.4% Mode Split =20.9% in 2022 AAGR = 8.9% 3.3% 4.2% 4.6% 2.8% 3.5% 3.7%
V/Line train and coach patronage has increased significantly since 2005/06, but were significantly impacted by the RFR project in the preceding years V/Line Train and Coach Patronage :2000/01 to 12 months ending March 2008 (millions of boardings per year) Metropolitan modelling was undertaken based on patronage growth between 2002 and 2007 Service levels significantly impacted by Regional Fast Rail development Millions of boardings Source: PTD Quarterly Report – Patronage (regional) (March 2008) Source: PTD Quarterly Report – Patronage (regional) (March 2008)
Recent growth is most likely driven by many of the same factors driving growth on metropolitan trains Annual Average growth for 12 months ending December 2007 for Metropolitan Train and V/Line Train & Coach services Average Annual Growth Rates (%)12 months ending Dec 2007 20% reduction in V/Line ticket price was introduced in March 2007 which had an additional positive effect on patronage The same factors driving metro train growth (petrol prices, population growth, CBD employment growth, congestion) are also likely to be operating on V/Line patronage, some at even higher levels of importance (e.g. petrol prices) Source: PTD Quarterly Report – Patronage (regional) (March 2008), PTD Official Patronage Series (March 2008)
This growth is not unprecedented – UK growth has been strong for a decade with no end in sight! A decade of strong growth in the UK with no slowdown apparent
The electric train network reaches most – but not all – of the city’s urban area Melbourne hasfour groups of electrified rail lines, providing thespine of the public transportnetwork. VLine regional trains service regional citiesand satellitetowns, as well as some suburbs on the city’s edge.
The rate of growth varies, but it is at historic levels all across the city Clifton Hill Rail Group(5.9%) Northern Rail Group(12.9%) Burnley Rail Group(4.3%) Annual Growth Rates in AM Peak Train Loads (2004-07) Caulfield Rail Group(8.4%)
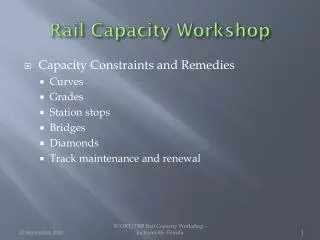
There are many examples of track constraints across Melbourne