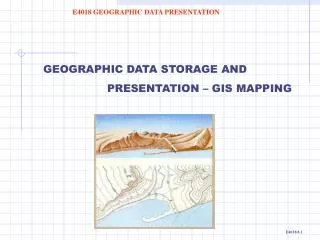
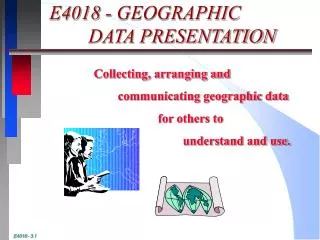
E4018 - GEOGRAPHIC DATA PRESENTATION
E4018 - GEOGRAPHIC DATA PRESENTATION. Collecting, arranging and communicating geographic data for others to understand and use. CARTOGRAPHIC PRESENTATION INTRODUCTION. Cartographic principles. Graphics classification. Terms and references.

E4018 - GEOGRAPHIC DATA PRESENTATION
E N D
Presentation Transcript
E4018 - GEOGRAPHIC DATA PRESENTATION Collecting, arranging and communicating geographic data for others to understand and use.
CARTOGRAPHIC PRESENTATION INTRODUCTION Cartographic principles Graphics classification Terms and references READINGAND INTERPRETATION OF GRAPHICS Reading and understanding maps. Measuring on maps. THEMATIC MAP DESIGN AND PRESENTATION Thematic map types and purpose GRAPHIC COMPILATION AND COMPLETION Gathering and arranging information GRAPHIC PRESENTATION Displaying the graphic E4018 MODULE STRUCTURE
DATA DISSEMINATION MANAGEMENT PROCESSING ACQUISITION • Amalgamation •Field surveying •Computation Generic/ thematic •Editing (client specific): •Photogrammetry •Integration •Derived •Maps, plans, •Adjustment •Modelling mapping diagrams •Interpretation •Planning •Reference data •Reports, statistics •Remote sensing •Decision •Geographic •Analysis making •GPS position data, (virtual and •Marketing ‘’’’’’’’’’’’’’’’’’’’’’’’’’’’’’ DEM’S physical) Additional geo- •Quality analysis •Geo-referenced •Quality ref. attribute •Integrity/ legal “social” control data input. •Client “contact” information •Storage •Hydrographic •Transfer •Electronic display •Geographic standards •Electronic “maps” (physical and •Product • Set-out data human) communication •Design •Social enhancements •Distribution •Environmental •Ownership • R and D GEOMATICS CONCEPT
Graphic: • Who or how many is the graphic for? • The user’s ability. • What is the graphic going to be used for - scale and accuracy need? • Type of presentation (animated, 2D, 3D, topographic map, hydrographic chart, statistical map etc or a combination). • Presentation form (VDU, hardcopy, multiple copies, colour, etc). Data: • What data is needed? How much detail? • Is the data supplied or does it need to be gathered? • What type of grid system (projection) will be needed. CREATING A GRAPHIC
l Graticule: A pattern of lines of latitude and longitude . f f l Grid: A plane rectangular system produces a set of horizontal and vertical lines intersecting at right angles. MAP PROJECTIONS AND CO-ORDINATES Other grid systems will have the curvilinear lines, which may be parallel or converge or be circles.
TYPES OF PROJECTIONS CYLINDRICAL PROJECTION Rolled out cylinder gives a classic grid shape Developable surface The cylinder is in contact around the globe - in this case along the equator SP - Standard parallel & CM -Central meridian
Transverse cylindrical projection NP Equator Skewed cylinder SP Central meridian NP Equator SP Standard parallel - eg. 350
Developable surface Conical grid pattern Generating globe CONIC PROJECTION
AZIMUTHAL PROJECTION Plane coincident with the pole Generating globe or earths surface Azimuthal grid pattern
PORTRAYAL PURPOSE OF MAP PROJECTIONS There are hundreds of map projections but many are not useful except as a novel display method. Different projections will portray one quality or another, viz. distance or area or shape or azimuth accuracy.
Equidistant (accuracy of scale): Scale is true in all directions from one point (sometimes two). Equivalent (accuracy of area): Area or size relationships are true. Scale is inconsistent and shape is incorrect. Conformal (accuracy of shape): Scale is the same in all directions from a point - varies from point to point. An orthomonic projection providing true angle measurement at a point and a right angle at f & l intersections. Azimuthal (accuracy of azimuth): Correct azimuth from one point (sometimes two).
AUSTRALIAN MAPPING GRID SYSTEM N - S ZONES (80) False origin 500,000m W (of CM in each Zone) 10,000,000m South(of equator) CM for Zone 49 E - W ZONES (60) - 00 AT GREENWICH
1:100,000 maps are½o x ½o λ and are represented by a 4 figure number,eg. 8948 100,000 MAP SHEET NUMBERING SYSTEM 89 is the E-W increment (½o λ )and48 the N-S increment (½o ) number.
1:250,000 maps cover 1o x 1½o λ 1½o λ 8748 8848 8948 1:100,000 maps cover ½o x ½o λ 1o 8847 8947 8747 1:100,000 map numbers
1:100,000 MAPS AREA 8948 ( ½o x ½o λ) 8948 1:50,000 8948-1 8948-4 8948-2 8948-3 4 1 3 2 1:25,000 8948-23
SCALE IS THE RATIO OF A CHANGE OF THE REPRESENTATION COMPARED WITH THE ORIGINAL. (A UNITLESS VALUE) 1 MAP DISTANCE SCALE = ie. 4000 GROUND DISTANCE PLAN SCALES Detail eg. 1:20 Site eg. 1: 100 Large eg. 1:5000 Small eg. 1:10000 MAP SCALES Large eg. 1:1000 - 1:25000 Medium eg. 1:50000 - 1:100000 Small eg. 1:250000 & smaller
Supporting detail for the lecture are found in your text book - Module 3 THINGS TO NOTE APPENDIX 3.2: GLOSSARY OF TERMS APPENDIX 3.3: SELECTED BIBLIOGRAPHY AND WEB ADDRESSES APPENDIX 3.4: GEOMETRIC CONSTRUCTION NOTES
S U M M A R Y • Data presentation stages require: • Collection • Arranging and amalgamation • Communication Produced for someone else to use and understand • Map projections - • Cylindrical, • Conical, • Azimuthal
Projection properties: • Equidistant (accuracy of scale). • Equivalent (accuracy of area). • Conformal (accuracy of shape). • Azimuthal (accuracy of azimuth). SCALE : (A UNITLESS VALUE) IS THE RATIO OF CHANGE (REPRESENTATION COMPARED WITH THE ORIGINAL