8 . Geographic Data Modeling
8 . Geographic Data Modeling. Outline. Definitions Data models / modeling GIS data models Topology. Definitions. Data model set of constructs for representing objects and processes in the digital environment Representation Focus on conceptual and scientific issues. Role of a Data Model.

8 . Geographic Data Modeling
E N D
Presentation Transcript
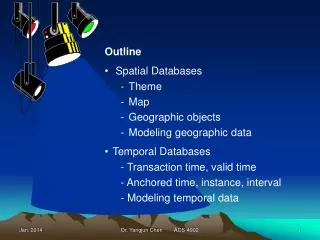
Outline • Definitions • Data models / modeling • GIS data models • Topology
Definitions • Data model • set of constructs for representing objects and processes in the digital environment • Representation • Focus on conceptual and scientific issues
How is a GIS map organized? A GIS map consists of one or more data layers. Each layers contains a collection of features that represent real-world objects.
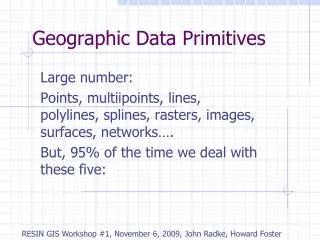
GIS Data Models & Applications • CAD • Graphical • Image • Raster/Grid • Network • Geo-relational • TIN • Object • Engineering design • Simple mapping • Image processing and analysis • Spatial analysis / modeling • Network analysis • Geoprocessing geometric features • Surface /terrain analysis / modeling • Features with behavior
Raster and Vector Models • Raster – implementation of field conceptual model • Array of cells used to represent objects • Useful as background maps and for spatial analysis • Vector – implementation of discrete object conceptual model • Point, line and polygon representations • Widely used in cartography, and network analysis
Raster • Spatial features modeled with grids, or pixels • Grid cells identified by row and column number • Grid cells are usually square in shape • The dimension of each cell defines the resolution • Each cell store only one attribute, in the form of a “z” value – cell value
Generic structure for a grid Grid extent Grid cell s w o R Resolution Columns Figure 3.1 Generic structure for a grid.
Cell Values: One Value per Cell • Each pixel or cell is assumed to have only one value • This is often inaccurate -the boundary of two soil types may run across the middle of a pixel • In such cases the pixel is given the value of the largest fraction of the cell (this is called dominant rule)
Raster data compression • Run length encoding can be more efficient • One of data compression methods Data entered as pairs, first run length, then value • Example: this array would be entered as: 3 0 5 2 8 5 9 1 5 3 • There are 10 items to enter, instead of 30
Vector Model • Points are defined by a single x,y coordinate pair • Lines are defined by two or more x,y coordinate pairs • Polygons are defined by lines that close to form the polygon boundaries • In the vector data model, every feature is assigned a unique numerical identifier, which is stored with the feature record in an attribute table.
Raster and Vector representations of the same land use Raster Vector
Which data model should you use? • Both the vector and raster data models are useful for representing geographic data, but one may be more appropriate than the other when it comes to representing a particular type of geographic data or answering different kinds of questions. • In general, use the vector data model when you want to represent features that have discrete boundaries. For example, a building is well represented as a polygon feature with x,y coordinates recorded for its corners. • The raster data model is very useful for representing continuous geographic data; that is, phenomena such as elevation, precipitation, and temperature, which don't have well-defined boundaries and which usually change gradually across a given area.
Discrete features can be represented using either vector or raster, but … Representing discrete features in the raster data model is less accurate.
Figure 3.10 Effect of changing resolution in the raster (left) and vector worlds (right)
Vector GIS: Topology • Topology (from the Greek τόπος, “place”, and λόγος, “study”) is a major area of mathematics concerned with properties that are preserved under continuous deformations of objects, such as deformations that involve stretching, but no tearing or gluing. It emerged through the development of concepts from geometry and set theory, such as space, dimension, and transformation. • Also called rubber sheet geometry. • Science and mathematics of geometric relationships • Simple features + topological rules • Connectivity • Adjacency • Intersection (shared nodes/edges) • Topology uses • Data validation • Spatial analysis (e.g. network tracing, polygon adjacency)
Topology Defines Spatial Relationships • Relationships based on location are called spatial relationships. • Four basic types of spatial relationships: distance, containment, intersection, and adjacency. • Getting answers to questions that are based on spatial relationships is the reason people use a GIS. • Examples of questions that can be answered using feature spatial relationships are: - How many houses are less than 1 mile from the airport? - Which parcels are contained by the contamination plume? - Which bridges intersect the fault line? - Which land uses are adjacent to the proposed subdivision?
Points within a given distance of the red point Points contained by the polygon Lines that intersect the red line Polygons adjacent to the red polygons
Vector Topology helps deal with: slivers overshoots dangles Not sharing border
Vector Topology Table in ArcGIS A table of the polygon topology Graphical display of arcs, nodes, vertices and lines Topology table for the ARCs making up the polygons
Vector Topology Table Graphical display of arcs, nodes, vertices and lines
GIS Network Data Model Figure 8.11 An example street network
Link, turn and stop impedances affecting the journey of a delivery van