Download
1 / 27
270 likes | 543 Vues
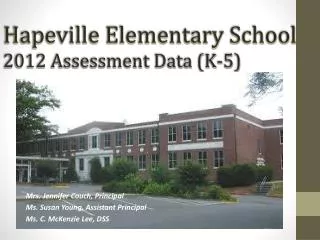
Hapeville Elementary School 2012 Assessment Data (K-5). Mrs. Jennifer Couch, Principal Ms. Susan Young, Assistant Principal Ms. C. McKenzie Lee, DSS. 1 st Grade Instructional Assessment Data. Key: Achievement < 70% proficiency. 1 st Grade Standards Assessed: ELA. Key:

E N D
Hapeville Elementary School2012 Assessment Data (K-5) Mrs. Jennifer Couch, Principal Ms. Susan Young, Assistant Principal Ms. C. McKenzie Lee, DSS
Key: Achievement < 70% proficiency 1st Grade Standards Assessed: ELA
Key: Achievement < 70% proficiency 1st Grade Standards Assessed: ELA
Key: Achievement < 70% proficiency 1st Grade Standards Assessed: Mathematics
Key: Achievement < 70% proficiency 1stGrade Standards Assessed: Mathematics
Key: Achievement < 70% proficiency 1st Grade ELA Standards Assessed: Mathematics
Key: Achievement < 70% proficiency 2nd Grade Standards Assessed: ELA
Key: Achievement < 70% proficiency 2nd Grade Standards Assessed: ELA
Key: Achievement < 70% proficiency 2nd Grade Standards Assessed: Math
Progression Over Time 2009 – 2010 To 2011 - 2012
Reading Data Progression Over Time Percentage of students meeting or exceeding Year Standards Assessed 4th grade showed a 6 percentage point increase in Reading overall!!
ELA Data Progression Over Time Percentage of students meeting or exceeding Year Standards Assessed 3rd grade showed a 4 percentage point increase in ELA. 4th grade showed an 8 percentage point increase in ELA overall.
Math Data Progression Over Time Percentage of students meeting or exceeding Year Standards Assessed 3rd grade showed a 4 percentage point increase in Math overall!!
Science Data Progression Over Time Percentage of students meeting or exceeding Year Standards Assessed 3rd grade showed an 8 percentage point increase in Science overall. 4thgrade showed a 15 percentage point increase in Science overall. 5thgrade showed a 11 percentage point increase in Science overall.
Social Studies Data Progression Over Time Percentage of students meeting or exceeding Year Standards Assessed 5thgrade showed a 28% increase in Social Studies overall.
2012 CRCT Domains To increase student achievement, the following slides present the percentage of students who scored LESS THAN 70% in the respective domains on the 2012 CRCT. Although the CRCT’s proficient level is below 70%, this data will support classroom differentiated instruction.
Percentage of students scoring less than 70% 73% 60% 60% READINGPercentage of Students who scored LESS THAN 70%3rd – 5th Grade 31% 23% 22% (Only 3rd grade assessed) (Only 4th and 5th grades assessed) Domains Assessed
ENGLISH/ LANGUAGE ARTSPercentage of Students who scored LESS THAN 70%3rd – 5th Grade Percentage of students scoring less than 70% 51% 51% 45% 40% 40% 33% Domains Assessed
MATHPercentage of Students who scored LESS THAN 70%3rd – 5th Grade 64% Percentage of students scoring less than 70% 63% 63% 61% 57% 52% 52% 52% 48% 48% 47% 44% 44% 42% 31% Domains Assessed
Life Science is the study of living things. Earth Science is the study of the solar system , landforms, and the resources of the earth. Physical Science is the study of matter, and energy. SCIENCEPercentage of Students who scored LESS THAN 70%3rd – 5th Grade Percentage of students scoring less than 70% 85% 80% 76% 72% 67% 62% 58% 55% 43% Domains Assessed
Civics and Economics examine the roles citizens play in the political, governmental, and economic systems in the United States. History is the study of past events SOCIAL STUDIESPercentage of Students who scored LESS THAN 70%3rd – 5th Grade Percentage of students scoring less than 70% 95% 91% 87% 85% 82% 79% 78% 72% 71% 70% 58% 55% Domains Assessed
What can you do at home? READ! READ! READ! EVERYDAY! WITH YOUR CHILD! TO YOUR CHILD! • Create a dictionary at home that gives multiple definitions for words (ex. Fly 1. to move across a distance without touching the ground 2. to look good to the observer 3. a zipper on your pants 4. an insect. • Create a graphic organizer to complete before, during, and while reading stories read or read aloud. • Design a chain of events on small squares of paper and rearrange them in sequential order. • Determine whether stories are fact (real) or fiction (fake). • Identify the parts of words that your child knows and use context clues to determine meanings.
What can you do at home? PRACTICE EVERYDAY! PRACTICE EVERYDAY! • Practice skip counting by 1, 2, 5 and 10. • Allow your child to write down times of the day when they do certain activities at home. • Determine the highest bill to be used to make a purchase. • Count back the change. • Name the shape, list the number of sides, and corners (ex. What shape is a refrigerator) • Allow your child to divide food into equal groups and equal pieces and write the fraction. • Use cards and dominoes to add and subtract. *Activities will be shown on September 27, 2012 during Curriculum Night. • Create different types of graphs around your house. (tally mark, bar graph)