Download

1 / 17
170 likes | 295 Vues
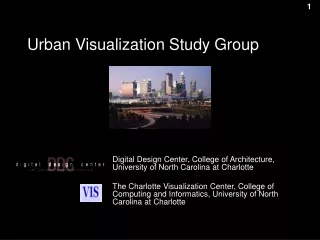
Research to Reality William Ribarsky Remco Chang University of North Carolina at Charlotte. Some Tools in Use that Were Developed at the SouthEast RVAC. The SRVAC developed several tools and capabilities for complex problem-solving and analysis, typically with large-scale data.

E N D
Research to Reality William Ribarsky Remco Chang University of North Carolina at Charlotte
Some Tools in Use that Were Developed at the SouthEast RVAC • The SRVAC developed several tools and capabilities for complex problem-solving and analysis, typically with large-scale data. • The tools support exploration, discovery, insight-gathering, knowledge-building, that often involve uncertain or misleading data. • These tools are general and can be used by companies, in the CCI Directorate programs, and by several of the Centers of Excellence.
Jigsaw • Problem - Helping analysts and investigators explore and understand large collections of reportsand data • Solution - Integrated, interactive views of report entities that highlight connections between items of interest and permits exploration to discover new connections • Impact – used at PNNL and the Seattle Police Dept.
A sample of Jigsaw’s document and entity views. Upper left: Document View. Displays the text and entities of a selected document. Upper Right: List View. Lists of the different entities with connections between them Lower Right: Calendar View shows temporal patterns across the documents. Lower Left: Graph View. Provides a semantic graph representation of documents (white circles) and the entities contained within them (colored circles). Jigsaw
WireVis: Financial Transaction Analysis This work is supported in part by Bank of America. (Significantly wider deployment to other banks and bank analysts now under discussion.) Current practice is to do database queries filtered by keywords, amounts, date, etc. and investigate using spreadsheets. This process is inadequate and inefficient because it is difficult to be exploratory using query methods (especially for very large transactional databases). Patterns of interest (e.g., fraud or risk) will change in unpredictable ways,, and analysts cannot see patterns over longer time periods.
WireVis: Financial Transaction AnalysisSystem Overview Search by Example (Find Similar Accounts) Heatmap View (Accounts to Keywords Relationship) Keyword Network (Keyword Relationships) Strings and Beads (Relationships over Time)
Scalability We have connected to the data warehouse at Bank of America with 10-20 millions of records, for wire transactions alone, over the course of a rolling year (13 months). High Impact WireVis was deployed as a beta at WireWatch. This interactive visual analytical approach has caused a change in the way some BoA analysts think about tools. WireVis:Integrated with Full Transaction Database Database SQL JDBC Stored Procedure Raw Data Temp Tables WireVis Client
EventRiver: Exploratory Multimedia Analysis • Tools to attack the 95% of the digital world that is unstructured multimedia. • Automated analysis tightly coupled with exploratory capability
EventRiver: Expanded Capabilities Opinion Analysis Geographic/Temporal Entity Extraction Comparative Event Trend Analysis
Realizing the Tools • There is a cost to realizing academic tools… • Goals of an academic is often different from that of a client • Time to understand each other’s language/system/culture, etc… • Cost of inertia (“I’ve been doing my job for 20 years and I’ve been fine, why do I have to change?”) • Cost of deployment (e.g. for security purposes).
Realizing the Tools • How to minimize the costs? • Close partnership with investigators, analysts. (Need a champion!) • Generalization of needs and capabilities • Cognitive and reasoning task-based evaluations • Development of principles for highly interactive visual analytics systems. • Several other tools have been developed and are currently being deployed (UrbanVis, ProbeVis, GTDVis, Image Browser, etc.)
Questions? www.srvac.uncc.edu www.viscenter.uncc.edu
Performance Measurements Data-driven operations such as re-clustering, drilldown, transaction search by keywords require worst case of 1-2 minutes. All other interactions remain real time No pre-computation / caching Single CPU desktop computer WireVis is in deployment on James Price’s computer at WireWatch for testing and evaluation WireVis:Integrated with Full Transaction Database
Visual GTD Flow Chart Entity Relationships (Geo-temporal Vis) Dimensional Relationships (ParallelSets) Entity Analysis (Search By Example)
WHO – Terrorist Groups Five Flexible Entry Components What WHERE~ WHEN
Enter System by single or multiple Selections System will supply Specific Information Drilldown to Original Info
Example 2: Time Series Animation Exchange rates into USD for British Pount and Deutchsmark decreased dramatically from 1980 August to 1985 Jan. Exchange rates into USD for Deutchsmark, Japanese Yen, and Swiss Franc increased dramatically from 1985 Feb. to 1987.