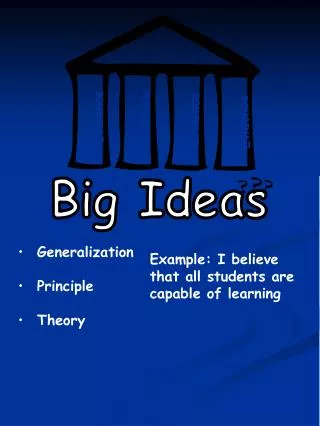
Big Ideas Data Analysis
Dive into the significance of data organization, classification, inference techniques, graphical representations, and statistical measures to gain a comprehensive understanding of populations through insightful analysis. Learn how different data presentations impact interpretation and discover the essence of grasping data shape over mere numerical data points. This resource is drawn from the guidance in "Elementary and Middle School Mathematics: Teaching Developmentally" by Van de Walle (Chapter 22, p. 452).

Big Ideas Data Analysis
E N D
Presentation Transcript
Big Ideas Data Analysis • 1. • A collection of objects with various attributes can be classified or sorted in different ways. • A single object can belong to more than one class. Classification is the first step in the organization of data.
Big Ideas Data Analysis • 2. • Data are gathered and organized in order to answer questions about populations from which the data come. • With data from only a sample of the population, inferences are made about the population.
Big Ideas Data Analysis • 3. • Different types of graphs and other data organizations provide different information about the data and the population from which the data are taken. • The choice of graphical representation can impact how well the data are understood.
Big Ideas Data Analysis • 4. • Measures that describe data with numbers are called statistics. • Data can be organized in various graphical forms to visually convey information. • The use of a particular graph or statistic can mediate what the data tell about the population.
Big Ideas Data Analysis • 5. • Both graphs and statistics can provide a sense of the shape of the data, including how spread out or how centered they are. • Having a sense of the shape of the data is having a big picture of the data rather than a collection of numbers.
Reference • Elementary and Middle School Mathematics, • Teaching Developmentally, Chapter 22, p. 452, Van De Walle.