Bollinger Bands Metastock User Group 11/5/02 Leland Brode elbrode@yahoo.com
Bollinger Bands Metastock User Group 11/5/02 Leland Brode elbrode@yahoo.com. Bollinger Bands - Outline. History Construction of Bollinger Bands Using Bollinger Bands “Bandwidth” and “%b” Building New Indicators with Bollinger Bands. History of Envelopes.


Bollinger Bands Metastock User Group 11/5/02 Leland Brode elbrode@yahoo.com
E N D
Presentation Transcript
Bollinger Bands Metastock User Group 11/5/02 Leland Brode elbrode@yahoo.com
Bollinger Bands - Outline • History • Construction of Bollinger Bands • Using Bollinger Bands • “Bandwidth” and “%b” • Building New Indicators with Bollinger Bands
History of Envelopes • “Twin-Line Chart” by LeDoux – 1960 • Upper band – line along monthly highs • Lower band – line along monthly lows • Buy when lower band exeeds upper band • “Ten Day Moving Average Rule” by Keltnur – 1960 • Establish concept of typical price (hi + lo + cl / 3) • Buy and Sell lines based on Moving Avg of above
Types of Envelopes • Trading Bands • Lines above and below a central tendency • Envelopes • Lines above and below by a % • Channels • Parallel lines above and below prices
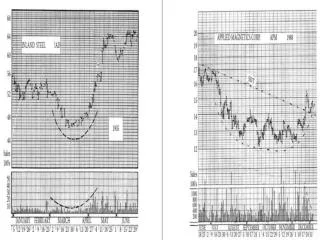
Envelope Examples – “Envelope”- 2 Moving Averages, one shifted up, the other down- Sell when reach upper envelope, buy when reach lower
Envelope Examples – “Price Channel”- Upper line is Highest High for n bars, Lowest Low for n bars- Indicate Support and Resistance lines
Envelope Examples – “Projection Bands”- Project Price over n bars forward ( completely contains prices )- Sell when reach upper band, buy when reach lower
Envelope Examples – “Standard Error Bands”- Bands are Standard Error above and below linear regression- Measures volatility, use with “r-squared” indicator
Bollinger Bands • John Bollinger – Financial News Network, “Market Technician” in 1980’s • Pioneered use of Standard Deviation for construction of price envelope in 1983 • Bollinger Bands are: • 20 bar moving average, • Upper Band is 2 Standard Deviations above Mov Ave, • Lower Band is 2 Standard Deviations below Mov Ave • Contains 89% of all prices • Shows Volatilitiy
Using Bollinger Bands • “The Squeeze” • Low volatility followed by break-out, higher volatility • Lower volatility marks end of trend, Opposite Band turns in at end of trend • “Walk the Bands” • Indicates strong trend • pullbacks to Moving Average • Sideways trend • tag of upper, followed by tag of lower band, and visa versa • If cross Mov Ave, then will continue to Band
Using Bollinger Bands – Patterns • Relative “W”, “M” pattern Becomes - relative Buy Band Tag
Using Bollinger Bands – Patterns • Relative “W”, “M” pattern Becomes - relative Band Tag Sell
Using Bollinger Bands – Use with other indicators • Confirm with other indicators • Bollinger Bands are a “price” indicator • Use Volume indicators • Volume only: • On Balance Volume • Volume Trend • Volume & Price: • Demand Index • Money Flow • PriceVolume Trend • Accum Distribution • Intraday Intensity • Chaiken AD Oscillator • Volume Weighted MACD ?
Bollinger Bands – with Money Flow Index (MFI) Declining MFI confirms downtrend MFI
Using Bollinger Bands – “Bandwidth, %b” • Bandwidth • Measures distance between upper and lower band • Greater distance -> greater volatility, strong trend • Use Bandwith to find “The Squeeze” • Lesser distance -> lesser volatility, sideways • Bandwidth formula • BBandTop(CLOSE, 20, S, 2) – BBandBot(CLOSE, 20, S, 2) • %b • Measures position of price relative to Bottom and Top bands • Range 0 to 1: 0 indicates bottom band tag, 1 indicates top band tag, .5 indicates in the middle • %b formula • (CLOSE – BBandBot(CLOSE, 20, S, 2)) / Fml(“BandWidth”)
Bollinger Bands – Applied to indicators • Apply Bollinger Bands to MFI, RSI, etc • Shows Range of Indicator (Standard Deviation) • %b of Indicator • Shows Relative Highs and Lows of indicator instead of Fixed Highs and Lows (80/20 Overbought/Oversold)
Bollinger Band – MetasStock Formulas Bollinger Band Components BandWidth1:BBandTop(CLOSE, 20, S, 2) - BBandBot(CLOSE, 20, S, 2) %b: (CLOSE - BBandBot(CLOSE, 20, S, 2)) / Fml( "BandWidth1") Bollinger Bands applied to Indicators Money Flow Index BandWidthMFI: BBandTop(MFI(14), 20, S, 2) – BBandBot(MFI(14), 20, S, 2) %bMFI: (MFI(17) – BBandBot(MFI(17), 20, S, 2)) / Fml(“BandWidthMFI”) Accum/Distribution BandWidthAD: BBandTop(AD(), 17, S, 2) – BBandBot(AD(), 17, S, 2) %bAD: (AD() – BBandBot(AD(), 17, S, 2)) / Fml(“BandWidthAD”) Chaiken AccumDistr Oscillator BandWidthADO: BBandTop(CO(), 20, S, 2) – BBandBot(CO(), 20, S, 2) %bADO: (ADO() – BBandBot(ADO(), 20, S, 2)) / Fml(“BandWidthADO”)
Intraday Momentum Index BandWidthIMI: BBandTop(IMI(17), 17, S, 2) – BBandBot(IMI(17), 17, S, 2) %bIMI: (IMI(17) – BBandBot(IMI(17), 17, S, 2)) / Fml(“BandWidthIMI”) Volume BandWidthVol: BBandTop(VOLUME, 27, S, 2) – BBandBot(VOLUME, 27, S, 2) %bVol: (VOLUME – BBandBot(VOLUME, 27, S, 2)) / Fml(“BandWidthVol”) RSI BandWidthRSI: BBandTop(RSI(CLOSE, 17), 17, S, 2) – BBandBot(RSI(CLOSE, 17), S, 2) %bRSI: (RSI(CLOSE,17) – BBandBot(RSI, 17) 17, S, 2)) / Fml(“BandWidthRSI”)
Generic BandWidth and %b BandWidth_20: BBandTop(p, 20, S, 2) – BBandBot(p, 20, S, 2) %b_20: (p – BBandBot(p, 20, S, 2)) / Fml(“BandWidth_20”)
Bollinger Bands - Summary • Provide Envelope for most of price action • Shows Volatility • “The Squeeze” – sharp moves occur after Squeeze • “Walking the Bands” – move outside band, continue trend • “M” and “W” Patterns – convert to Relative M, W, trend change • A move that originates at one band goes to the other band • A cross of Moving Avg continues to next band • Confirm with other indicators (Volume indicators) • Apply Bollinger Bands to other indicators
Bollinger Bands – Bibliography • “Bollinger on Bollinger Bands”, John Bollinger • “Technical Analysis of the Financial Markets”, John Murphy • “Getting Started in Technical Analysis”, Jack Schwager • “Technical Analysis for the Trading Professional”, Constance Brown • “Technical Analysis from A to Z”, Steven Achelis