
Bollinger Bands
E N D
Presentation Transcript
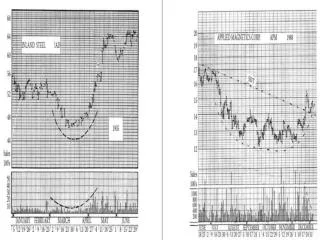
Bollinger Bands • Developed by John Bollinger , bollinger bands are volatility placed above and below a moving average. Volatility is based on the standard deviation, which changes as volatility increases and decreases. The bands automatically widen when volatility increases and narrow when volatility decreases. This dynamic nature of also means they can be used on different securities with the standard settings. For signals, bollinger bands can be used to identify M-Tops and W-Bottoms or to determine the strength of the trend. Signals derived from narrowing BandWidth are discussed in the chart school article on BandWidth.
Signal: Walking the Bands • Moves above or below the bands are not signals per se. As Bollinger puts it, moves that touch or exceed the bands are not signals, but rather "tags". On the face of it, a move to the upper band shows strength, while a sharp move to the lower band shows weakness. Momentum oscillators work much the same way. Overbought is not necessarily bullish. It takes strength to reach overbought levels and overbought conditions can extend in a strong uptrend. Similarly, prices can "walk the band" with numerous touches during a strong uptrend. Think about it for a moment. The upper band is 2 standard deviations above the 20-period simple moving average. It takes a pretty strong price move to exceed this upper band. An upper band touch that occurs after a Bollinger Band confirmed W-Bottom would signal the start of an uptrend. Just as a strong uptrend produces numerous upper band tags, it is also common for prices to never reach the lower band during an uptrend. The 20-day SMA sometimes acts as support. In fact, dips below the 20-day SMA sometimes provide buying opportunities before the next tag of the upper band.
Donchian Channel • The Donchian channel is an indicator used in market trading developed by Richard Donchian. It is formed by taking the highest high and the lowest low of the last n periods. The area between the high and the low is the channel for the period chosen. • It is commonly available on most trading platforms. On a charting program, a line is marked for the high and low values visually demonstrating the channel on the markets price (or other) values. • The Donchian channel is a useful indicator for seeing the volatility of a market price. If a price is stable the Donchian channel will be relatively narrow. If the price fluctuates a lot the Donchian channel will be wider. Its primary use, however, is for providing signals for long and short positions. If a security trades above its highest n periods high, then a long is established. If it trades below its lowest n periods low, then a short is established.
Trend Following Average True Range (ATR Trailing Stop) Sell Buy
Darvas Box • Definition of 'Darvas Box Theory' • A trading strategy that was developed in 1956 by former ballroom dancer Nicolas Darvas. Darvas' trading technique involved buying into stocks that were trading at new 52-week highs with correspondingly high volumes.A Darvas box is created when the price of a stock rises above the previous 52-week high, but then falls back to a price not far from that high. If the price falls too much, it can be a signal of a false breakout, otherwise the lower price is used as the bottom of the box and the high as the top. • Investopedia explains 'Darvas Box Theory' • In 1956, Darvas was able to turn an investment of $10,000 into $2 million over an 18-month period. While traveling for his dancing, Darvas would obtain copies of The Wall Street Journal and Barron's, but he would only look at the stock prices to make his decisions. It has been said that Darvas was less happy about the profits that he made than he was about the ease and peace of mind that he got from implementing his system.Skeptics of Darvas' technique attribute his success to the fact that he was trading in a very bullish market. They also say that returns comparable to the ones he saw can't be attained if this technique is used in a bear market.
NASDAQCoincidence? Combing Donchian Channels, Moving Average lines & Gann/Fib Retracements
Three stocks breaking-out, mentioned in IBD New High List Analysis