Download
1 / 55
570 likes | 1.07k Vues
Multi-temporal assessment of above-ground forest biomass using aerial photography and allometric equations. An M.Sc thesis by: Avi Bar-Massada 1 Academic advisors: Dr. Yohay Carmel 1 , Dr. Gilad Even-Tzur 1 and Prof. Dan Yakir 2 1 Faculty of Civil and Environmental Engineering

E N D
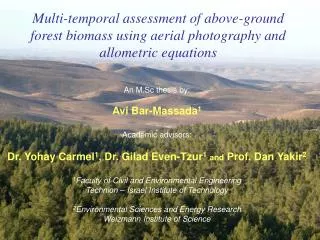
Multi-temporal assessment of above-ground forest biomass using aerial photography and allometric equations An M.Sc thesis by: Avi Bar-Massada1 Academic advisors: Dr. Yohay Carmel1, Dr. Gilad Even-Tzur1and Prof. Dan Yakir2 1Faculty of Civil and Environmental Engineering Technion – Israel Institute of Technology 2Environmental Sciences and Energy Research Weizmann Institute of Science
Motivation • Forest biomass dynamics have a major role in the study of global warming and land cover change. • Traditional biomass dynamics assessment methods rely on long-term forest inventory data, that exist only in few countries in the world. • Thus, it is desirable to develop an alternative method for forest biomass dynamics assessment.
Objective • Development of a method for estimating the dynamics of above-ground forest biomass. • The method introduces a combination of two distinct scientific fields: Allometry and Photogrammetry. • The method will be applied to Yatir forest, southern Israel.
What isBiomass? • Biomass represents the amount of organic (biological) matter in a system. In plants, the amount is defined as dry weight. • In terms of ecosystems, Biomass is usually defined per unit area (“biomass density”). Common units are Kg dry weight / m2 .
Biomass Measurements • The accurate measurement of biomass is “chop and burn” • Common biomass assessment methods rely on allometric equations. • These equations quantify relationships between various structural components of plants, such as biomass, DBH, crown diameter, height etc. • The relationships are species-specific, and site-specific.
For example: (Source: Grunzweig, unpublished data)
Multi-temporal biomass studies usually require many years of field sampling. • In places where no such field-data exists, it may be useful to generate data retroactively, via other data sources. • Aerial-photographs may provide high resolution spatial data for several decades
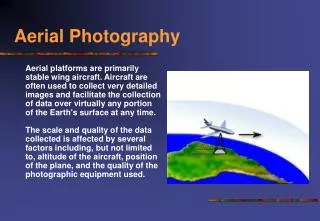
Photogrammetric Measurements • Photogrammetry is the science of determining the position and shape of objects from photographs. • Using a couple of overlapping photos (a stereo pair), it is possible to calculate the 3D characteristics of objects appearing on the photos. image • Thus, it is possible to measure tree height and crown diameter from aerial photographs.
It is possible to obtain parameters for the allometric equations through photogrammetric measurements of aerial photographs. • By repeating such a process in different years, we can describe the dynamics of the above-ground woody components of the forest biomass.
StudyArea • The research will be conducted on Yatir Forest, an arid-land forest in southern Israel. • This is the largest planted forest in Israel, consisting mainly Pinus halepensis (Jerusalem Pine) species. Planting started in the mid 60’s.
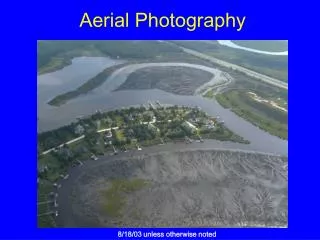
Data Acquisition: Aerial photographs • 1:13000 panchromatic aerial photographs of Yatir forest in previous years: 1978, 1987, 1992 and 1996, were obtained from MAPI. • A new set of photos was acquired in a photographic flight mission, in summer 2003. • Low-scale and panchromatic photos were used since this represents the available data in photo-archives in Israel.
Ground control points collection • The photogrammetric process requires the usage of ground control points (GCP’s). • 12 GCP’s were collected using an Ashtech Z surveyor GPS.
Stereoscopic models solutions • The stereo-models were solved in ERDAS IMAGINE 8.6 OrthoBASE software, using the photos, camera calibration information and the GCP’s. • Overall, Five stereo-models were solved: one for each period: 1978, 1987, 1992, 1996 and 2003. • In addition to the stereo-models, orthophotos were generated for each model.
Stereo-models solutions • The overall quality of the solutions is satisfying:
Tree height measurements • Individual tree height was measured in monoscopic view. • The software measures absolute height (above sea level). Thus, tree ground height needs to be measured.
Tree height measurements • Since the canopy blocks the view of tree ground height, it needs to be estimated. • Tree ground height is estimated as the projection of the tree apex on a DSM.
Height measurements • The height variability between plots could not be explained by the environmental variables. • Presumably, the differences are results of local plot characteristics: micro-hydrology etc.
Crown diameter measurements • Tree crown diameter was digitized from an orthophoto, in ArcGIS software, for all trees with a measured height.
Allometric equations generation • 28 Pinus halepensis trees were selected, cropped, measured, and sampled. The samples were later oven-dried to assess moisture content.
(R2=0.957) (R2=0.947) (R2=0.982) Allometric equations • Linear regressions of these biomass data are invalid since data exhibits heteroscedasticity. • Therefore, selection was made between three log-transformed non-linear equations:
Biomass calculations • The selected allometric equation, with the height and crown diameter corrected data for all years, were used to calculate the biomass for all of the trees in the study (2127 trees). • Spatial and temporal analysis was done to describe the biomass dynamics (spatial variability, accumulation rates).
Stand density measurement • To assess the entire study area density, 16457 trees were digitized from the 2003 orthophoto.
Measurements error assessment • The tree measurements in this method are exposed to two types of errors: • Photogrammetric solution error. • Operator errors (false apex, wrong correspondence).
Measurements error assessment • The empirical estimation of the model error involves a comparison between computer measurements and field data. • The validation data set includes 60 trees. Each one of them was measured for height and crown diameter in the computer and in the field. • Tree field height was measured with the clinometer and tape method. Crown diameter was measured with a tape, according to the direction of the photo.
Measurements error assessment • The measurement errors were statistically analyzed. Mean errors, RMSE and error distributions were determined. T-test was conducted to check whether measurement error is related to tree size. • The resulting mean errors were used to calibrate all tree measurements in this study.
Measurement error assessment • Height and crown diameter errors are computed as model height minus real height. Height error Crown diameter error
Measurement error assessment • There was no significant relation between error and tree height (p=0.3), and between error and crown diameter (p=0.72). • Therefore, the correction factors are valid for all years: • Height correction: -0.762m • Crown diameter correction: +0.474m
Error analysis: the reliability of mean biomass • One might wonder whether the mean biomass value is reliable, considering the measurement errors. • Since error data is not normally distributed, standard error propagation methods can not be used. • An alternative approach is using a randomization test, with mean biomass as the test statistic.
Error analysis: the reliability of mean biomass • The randomization test checks the following null hypothesis: • The test statistic is compared to a synthetic distribution of biomass means, generated by resampling combinations of tree data and error data.
Reliability of the mean biomass • The 1000 randomization iterations yielded the following distribution of means Bmean~N(93.58,2.34): Uncorrected biomass estimate Corrected estimate • The result can also be described as the 95% confidence interval [89.09,98.03]
Model performance • In order to fulfill the research objective, the model has to meet three requirements: • Accurate measurement of tree height and crown diameter per tree. • Accurate transformation of the height and crown diameter data to tree biomass. • The selected study plots are representative of the biomass in the study area.
1. Accurate measurement of tree height and crown diameter per tree: • This requirement is validated through the error-assessment step. • The mean absolute error of tree height was lower than the value reported by Gong et al (2002), although that research used a better measurement technique and better data.
2. Accurate transformation of the height and crown diameter data to tree biomass: • This requirement is validated by the quality of the allometric equation. • The allometric equation is highly significant. • The trees selected for harvesting are representative of the entire forest, since they follow an average height/dbh ratio.
3. The selected study plots are representative of the biomass in the study area: • This requirement is validated by the density representation of the study plots. • Since all trees in are in the same age, and the environmental variables in their area are similar, stand density was assumed to be the major factor controlling biomass growth. • The mean density of the plots is close to that of the study area, thus they represent the density variability well.
Conclusion • A new approach for the assessment of forest above-ground tree biomass dynamics was presented. • The method is a combination of two distinct scientific fields: photogrammetry and allometry. • The method performed well in a case study of Yatir forest.
Thank you! • And, thanks to the following people: Grad students from Geodesy, Technion, for the lessons in photogrammetry; undergrad students from Rehovot, for their hard work in the harvest and its post-processing; Dr. Ofer Zilberstain and Dr. Yuri Rizmann for their valuable comments regarding the method, Dr. Debbie Hemming and Dr. Jose Grunzweig for directing the harvest, Dr. Grunzweig also contributed much to the understanding of the results; My academic advisors: Dr. Gilad Even-Tsur and Prof. Dan Yakir for all of their help; and especially, for all the time, support and respect, my main advisor: Dr. Yohay Carmel.