Download
1 / 35
350 likes | 481 Vues
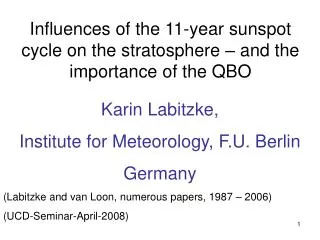
Influences of the 11-year sunspot cycle on the stratosphere – and the importance of the QBO. Karin Labitzke, Institute for Meteorology, F.U. Berlin Germany (Labitzke and van Loon, numerous papers, 1987 – 2006) (UCD-Seminar-April-2008). The topics of my lecture today are:

E N D
Influences of the 11-year sunspot cycle on the stratosphere – and the importance of the QBO Karin Labitzke, Institute for Meteorology, F.U. Berlin Germany (Labitzke and van Loon, numerous papers, 1987 – 2006) (UCD-Seminar-April-2008)
The topics of my lecture today are: 1) Variability of the Arctic Winters -- the Sun and the QBO 2) Solar Signals in Summer
1 2 3 4 5 4 5 3 2 1 1956 – 2008: trend = - 0.01 K/dec; sigma = 9.2K
3 1 2 4 1942 – 2008 n = 67 Hm = 2250,1 dm sigma = 45,2dm trend = + 0.42 dm/dec sign. 12 % 5 5 4 3 1 2
Standard Deviations for February and July 1948 - 2007 JUL 10 9 1 Temp Height Labitzke and Kunze, 2008) FEB
Different forcings influencing the stratospheric polar vortex during the northern winters
(grey = west; white = east) (50 + 40hPa in Jan + Feb)/4 Quasi-Biennial Oscillation QBO Time- height section of monthly mean zonal winds (m/s) at equatorial stations: Canton Island (3°S / 172°W) (Jan 1953 – Aug 1967); Gan/Maledive Islands (1°S /73°E) (Sep 1967 – Dec 1975); Singapore (1°N /104°E) (since Jan 1976). Isopleths are at 10 m/s intervals, westerlies are shaded ; (updated from Naujokat 1986).
The Quasi - Biennial Oscillation (1988 – 2007) ------ QBO-definition: 40+50hPa in Jan+Feb)/4
February red = warm event ~ El Nino blue = cold event SO no correlation with 11 year solar cycle r = 0.22 (n = 67) P CH A Tropical volcanoes W: Agung March 1963 E: Chichon March 1982 E: Pinatubo June 1991 solar min solar max
FU-Berlin QBO east phase QBO west phase 1958 - 1986 n = 16 r = 0.78 Correlations between 30-hPa Heights and the Solar Flux n = 13 r = - 0.7 1. 1958 -1986, ( n = 29 years ~3cycles; Labitzke (1987)
North Pole February 30 – hPa Heights, NCEP/NCAR + Rec. r = 0.66 22 years later and 16 years back; filled symbols = MMWs; n = 67 6.5 solar cycles; WE in red, CE in blue; van Loon and Labitzke (1994), updated)
A Stratospheric Major Midwinter Warming (MMW) is defined by a reversal of the temperature gradient (at the10hPa level)between the North Pole and 60°N (i.e., polar region warmer ) – and by a reversal of the normal westerlies to easterlies (winds from the east), i.e. a negative AO.
Solar Cycle; detrended 30hPa Height; WEST/QBO February 1958 – 2008; (n=51); NCEP/NCAR correlations min = - 0.34; max = 0.75; 5 solar cycles; max height diff. 640 m (~1.5 sigma)
Solar Cycle; detrended 30hPa Height; EAST/QBO February 1958 – 2008 (n=51) NCEP/NCAR correlations min = - 0.47; max = 0.67; 5 solar cycles; height diff. 440 m
Detrended Temp., February, NCEP/NCAR, 1958- 2008 solar max – solar min (shading = corr >+/- 0.4 ) n = 51, ~ 5 solar cycles
5 strongest MMWs in east min - +11 nodal points: ~ 30S and ~ 55N in both cases + -8 5 coldest winters in west min Deviations of the zonal mean temperatures (K) in (Jan+Feb)/2 from the long-term mean (1968 through 2002); (shading larger than 1 (2) standard deviations)
Teleconnections – QBO – Solar Cycle (in the middle stratosphere/ upper troposphere) Solar MIN – QBO West, northern winter: weakening of BDC (Holton + Tan) Equator N. Pole COLD vortex Solar MIN – QBO East, northern winter: intensification of BDC (Holton + Tan) Equator N. Pole
Teleconnections – QBO – Solar Cycle (in the middle stratosphere/ upper troposphere) Solar MIN – QBO West, northern winter: weakening of BDC (Holton + Tan) Equator N. Pole Solar MAX – QBO West, northern winter: intensification of BDC Equator N. Pole COLD vortex Solar MAX – QBO East, northern winter: some weakening of BDC Equator N. Pole Solar MIN – QBO East, northern winter: intensification of BDC (Holton + Tan) Equator N. Pole
July, Northern Summer, the dynamically least disturbed season
all; rmax = 0.69 east; rmax = 0.93 west; rmax=0.64 o Correlations between the solar flux and the detrended 30-hPa temperatures in July (1968 -2007); red = corr. > 0.4; blue is temp. diff. > 1K
! ! r = 0.84, Tdiff = 2.1 K r = 0.39, Tdiff = 0.8 K (sigma = 1K) (near Nagasaki)(Chichon = March 82/ east; Pinatubo = June 91/east )
near Nagasaki (1968 – 2007, n = 40) all r = 0.57 east r = 0.84 west r = 0.39
July, 1968 – 2005: Detrended Temperature Correlations (NCEP/NCAR) East: n = 18 r max = 0.86 > 99 % 10 32 km West: n = 20 r max = 0.57 200 90N (4 solar cycles) (Labitzke 2003, updated)
Temperature Differences, (solar max – min) July, 1968 - 2005 East n = 18 tropical warming = downwelling = weakening of Brewer-Dobson C. 3 West n = 20 Intensification of Hadley Circulation? More convection over equator? (-) +
Temperature Differences, (solar max – min) standardized: July, 1968 – 2007, n = 40 QBO/east - QBO/west
30-hPa Heights, solar max – solar min, bi-monthly through the year
30-hPa heights, solar max – solar min, (Jul + Aug)/2 anomalous wind from the west in solar max, i.e. weaker QBO/East in solar max anomalous wind from the east in solar max, again weaker QBO/West in solar max
Scatter diagrams of the zonal wind (m/s) over the equator at (40+50 hPa)/2 in July (absolute values) against the 10.7 cm solar flux. Period: 1953 – 2007 (n = 55, r = 0.07, Data set Fu-Berlin) Left: years in the east phase of the QBO (n = 25). Right: west phase The QBO is weaker in solar max and stronger in solar min!
The Constructed Annual Mean of the differences between solar max and solar min for the 30-hPa temperature and for the 30-hPa height, separately for the QBO east and west phases (1968 – 2004) (QBO/east is weaker in max) east east 80 l -- 30N l
The Constructed Annual Mean Differences, (solar max - solar min), separately for QBO east and west Temperature differences (K) Height differences (m) 10 E 1000 + + (-) + W +
solar min (H+T) QBO east is stronger QBO west isstronger and and polar vortex is polar vortex is warmer/weaker stronger/ colder But: solar max QBO east and west are weaker in max and the condition of the polar vortex is opposite to solar min ( and to H+T) Weaker QBO in Solar Max
July: correlations T (max-min) standardized all east west (1968 – 2007)