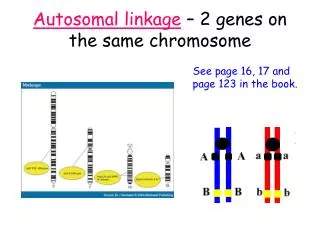
Linkage analysis: Two-factor testcross
Linkage analysis: Two-factor testcross. AaBb x aabb. AaBb, Aabb, aaBb, aabb. What are the implications of phenotypes scored on these progeny?. Linkage analysis: Two-factor testcross. Double heterozgyotes are mated with homozygous recessives Genotypes of a large number of progeny are scored

Linkage analysis: Two-factor testcross
E N D
Presentation Transcript
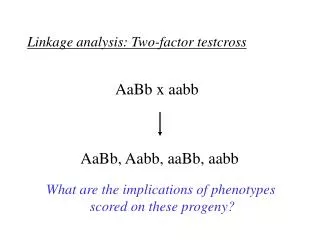
Linkage analysis: Two-factor testcross AaBb x aabb AaBb, Aabb, aaBb, aabb What are the implications of phenotypes scored on these progeny?
Linkage analysis: Two-factor testcross • Double heterozgyotes are mated with homozygous recessives • Genotypes of a large number of progeny are scored • If locus A and B are on different chromsomes, alleles will follow Mendel’s law of Independent Assortment • Genetically linked? Two of four genotypes more frequent than expected (c2 test statistic)
Linkage analysis: Interval mapping (Haley and Knott, 1992) A Q B rA rB rAB = rA + rB - 2rArB
Frequencies for F1 gametes and RI genotypes (Markel et al., 1996)
RI genotypic frequencies of two flanking markers and an intermediate QTL (Markel et al., 1996)
Expected additive effect coefficients of each pair of RI genotypes (Markel et al., 1996)
Coefficients (xi) of the additive effect of a QTL at five positions between two flanking markers of A and B that are 20 cM apart (Markel et al., 1996)
Maximum likelihood approach to QTL mapping (Lander and Botstein, 1988) • Assuming complete map coverage, is it possible to design a cross to make it highly likely that QTLs will be found? • Using flanking markers as opposed to single-marker analysis • Reduce the number of markers individually tested and thus reduce type I error
Traditional approach • Compare the mean phenotypic value of progeny with genotype AB to those with marker genotype AA • One-way analysis of variance • i.e., a linear regression • assume normally-distributed residual environmental variance
Number of progeny required for detection (Soller and Brody, 1976) • Assume that a QTL contributes s2exp to the genetic variance and is located exactly at a marker locus • (Za)2(s2res/s2exp) • Za is the number of standard deviations beyond with the normal curve contains probabilty a • Phenotypic effect may be underestimated if not at marker locus • Greater number of progeny if not at the marker • No definition of the likely position of the QTL • Multiple testing
Interval mapping of QTLs using LOD scores: Method of maximum likelihood • fi=a + bgi + e • gi is coded (0, 1) for number of B alleles • e is a random normal variable with mean 0 and variance s2 • b denotes the estimated phenotypic effect of a single allele substitution at a putative QTL • L(a, b, s2) = Piz((fi - (a + bgi)), s2) • LOD = log10(L(a’, b’, s2’)/L(mA’, ), s2B’))
Interval mapping of QTLs using LOD scores: Method of maximum likelihood • ELOD = 1/2log10(1 + s2exp/s2res) (a result from linear regression) • ~1/2(log10e)(s2exp/s2res) (Taylor expansion for small values of s2exp/s2res) • ~0.22(s2exp/s2res) • T/ELOD ~ (Za)2/(s2exp/s2res)
Interval mapping of QTLs using LOD scores(Lander and Botstein, 1988) • L(a, b,s2) = Pi[Gi(0)Li(0) + Gi(1)Li(1)] • Li(x) = z((fi - (a + bx)), s2) denotes likelihood function for individual I • Assumptions • gi = x • Gi(x) denotes the probability that gi = x conditional on the genotypes and positions of the flanking markers
Confirmation of EtOH sensitivity QTL in mouse (Markel et al., 1997)
Genetic map of EtOH-sensitivity QTL (Lore1 - 6; Markel et al., 1997)
Additive effect of confirmed QTL for alcohol sensitivity (Markel et al., 1997)
Marker-assisted breeding of congenic mouse strains (Markel et al, 1997b) • Yellow indicates the donor (D) genome • Blue represents the recipient (R) genome • Apoe is the target region of introgression • Left side represents traditional approach, while right the “speed” congenic method
Traditional congenic breeding strategy (Markel et al., 1997b)
Marker-assisted congenic breeding strategy (Markel et al., 1997)
Lecture 4: Mapping in humans (1 of 2) • Linkage analysis • Relative-pair analysis
Genetic mapping has been uncommon for human in most of the last century • Lack of abundant supply of markers • Inability to arrange human crosses to suit experimental purposes • Breakthrough with Botstein et al. (1980) for yeast • Use naturally occurring DNA sequence variation in humans • Led to mapping several hundred rare Mendelian diseases
Human Genetic Revolution • Human genetics has sparked a revolution in medical science • Can find genes behind disease without knowing how they function • Completely generic approach
Last two decades ushered in complex traits • Do not follow simple Mendelian monogenic inheritance • Heart disease, hypertension, diabetes, cancer, and infection
Defining disease • Clinical phenotype • Age at onset • Family history • Severity
The Population Allele frequencies + Environment The Metric • Prevalence • Risk • Heritability • Age of onset • Family history • Severity etc. Method/ Technique + Time/ Place The Sample }
Linkage Analysis: Overview • Simple Mendelian traits offer a small number of hypotheses for the geneticist to test. • Thus, the geneticist speculates based on Mendelian rules what the most appropriate model is to explain the pattern of relationship between observed phenotype and genotype.
Linkage analysis: Hypothesis • For simple mendelian traits, mendelian rules of gametic transmission can explain adequately the pattern of phenotypes in a multigenerational family: • M1 = a specified model that suggests a specific location for a trait-causing gene • Much more likely to have produced the observed data than • M0 = a model that suggests no linkage to a trait-causing gene in the region
Linkage analysis: Hypothesis • The evidence for M1 versus M0 is measured by the likelihood ratio LR = Prob(Data|M1)/Prob (Data|M0) • This is also presented as Z, the lod score Z = log10(LR) • (see 49, 50; Morton (1955))
Autosomal dominant trait 1 2 T / t, M1 / M2 t / t, M2 / M2 2 3 5 1 4 6 t/t M1/M2 T/t M2/M2 T/t M2/M2 T/t M1/M2 T/t M1/M2 t/t M1/m2
Basic calculations in human linkage analysis • Assign linkage phase • Calculate conditional probabilities • Observe the number of each class of paternal gametes in progeny • Probability of observed family given a model [L(q)] • Probability assuming independent assortment [L(0.5)] • Calculate likelihood ratio: LR = L(q)/L(0.5)
Assign linkage phase • Equivalent to experimental two-factor testcross • Linkage phase • Different sets of alleles on each member within a pair of homologous chromosomes (i.e, haplotype) • AB/ab is in coupling; Ab/aB is in repulsion • Marker alleles are codominant, so phase is arbitrary; coupling is TM1/tM2 and repulsion is tM1/TM2
Observe paternal gametes • n1 = TM1, n2 = TM2, n3 = tM1, and n4 = tM2 gametes • Six children in the present example • n1 = 1 • n2 = 2 • n3 = 3 • n4 = 0
Probability L(q) • Each offspring is an independent event so that: • L(q) = L(coupling)L(q) + L(repulsion)L(q) =0.5[0.5n(1 - q)n1+n4(q)n2+n3]+0.5[0.5n(1 - q)n2+n3(q)n1+n4] =0.5n+1[(1- q)n1+n4(q)n2+n3+(1- q)n2+n3(q)n1+n4] • The geneticist provides a reasonable value for q; in this case, what is a reasonable value for q?
Probability L(.167) • L(0.167) • = (0.5)7[(0.833)1(0.167)5+(0.833)5(0.167)1] • = 0.000524
L(0.5) • L(0.5)=.25n, n is the number of progeny • L(0.5) • =(0.25)6 • =0.000244
LR and Z • LR = L(q)/L(0.5) • = 0.00052/0.00024 • = 2.147 • Z = log10LR = 0.332 • Try different values of q • If recombinants (r) can be counted directly, then maximum likelihood estimate (MLE) = r/n
t/t, M1/M2 T/t, M2/M2 1 2 1 2 T / t, M1 / M2 t / t, M2 / M2 2 3 5 1 4 6 t/t M1/M2 T/t M2/M2 T/t M2/M2 T/t M1/M2 T/t M1/M2 t/t M1/m2
Father’s genotype is in repulsion • Assume father’s alleles are in repulsion (TM2/tM1) • L(q)=0.5n(1 - q)n2+n3(q)n1+n4 • L(0.167)=(0.5)6(0.833)5(0.167)=0.001046 • Multiple generations are thus valuable • Nearly twice the earlier value • Z improves by 0.3, underscoring the value of multi-generation pedigrees • How about two families of 6 children versus one family of 12?
Linkage analysis: Autosomal recessive trait • More complicated analysis; more families are required to demonstrate linkage between a marker locus and an autosomal recessive trait compared to autosomal dominant • Normal children can be Tt or TT; thus, alone can not be used to deduce linkage phase of doubly-heterozygous parent • Families with just one affected are not informative, even when several normal children are available • LR(q)=0.5[(1-q)1(q)0+(q)1(1-q)0] • =0.5[(1-q)+q] • =0.5
Allele frequency estimation • Allelic heterogeneity • Critical; rare versus common allele
Allele-sharing studies • Penrose (1935) • Haseman and Elston (1972) • Carey and Williamson (1993) • Fulker and Cardon (1994) • Lander et al. (1995)
Allele-sharing: Haseman and Elston (1972) • Can genetic variance be assigned to a locus? • Twin studies • Partition genetic variance • Do not address the contribution of individual loci • Sib-pairs • Addresses secular and age effects • Include information about parents
Allele-sharing: Haseman and Elston (1972) • Xij = m + gij + eij • gij= genotypic value; eij = environmental deviation • Assume random mating and linkage equilibrium • Yj= (sib-pair difference)2 • Estimate Y based on best estimate of the number of alleles the sibs share identical by descent (IBD)
Allele-sharing: Haseman and Elston (1972) • Let pj = proportion of genes shared IBD and Y = (x1j - x2j)2 for sib pair j • Develop expectation of Y if p known precisely at the disease locus • Estimate p(p’) given the genotypes of the parents (sometimes) and children for marker locus • Predict Y based on p’
Development of the model • E (Yj | pj) • E (p’ | Im) • p’ = estimate of p • Im = information about parent and sib genotypes • E (Y | p’)
E (Yj | pj) • For sib pair BB-Bb • x1j = m + a + e1j • x2j = m + d + e2j • Yj = (a + e1j - d - e2j)2 = (a - d + ej)2