Distracted Driving
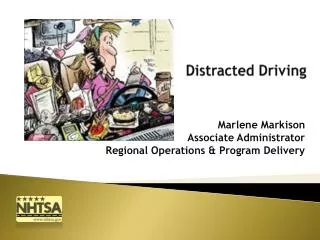
Distracted Driving. By: Joe MacGregor, Jeff Goldkamp, Doug Prikockis. Distracted Driving. Virtually everyone owns a cell phone Some studies indicate that drivers using their cell phones are 4 times more likely to be involved in an accident

Distracted Driving
E N D
Presentation Transcript
Distracted Driving By: Joe MacGregor, Jeff Goldkamp, Doug Prikockis
Distracted Driving • Virtually everyone owns a cell phone • Some studies indicate that drivers using their cell phones are 4 times more likely to be involved in an accident • The Federal Government warns motorists about using their cell phones while driving, but no state legislation has made it illegal • According to a Harvard study, 2,600 traffic deaths are caused by driving on their cell phone • 570,000 accidents leading to minor or serious injuries are a result of a driver(s) using their cell phones while driving
Collecting Data • We wanted to research how many people were on their phones while driving • 1412 total vehicles • 252 drivers on their cell phones • Observed type of car • Three Locations • Bristol Road & 611 • 3-4 pm • 611 & Valley Square • 4:05-5:05 pm • County Line & 152 • 5:20-6:20 pm • We observed the most amount of cell phone users at County Line & 152 • We expected to see more people using their cell phones • Proportion of females was greater than the proportion of females using their cell phones
1 Prop Z-Test Cont. • Assumptions 1. SRS 1.assumed 2.np>10 2. 1412(.17847)>10 n(1-p)>10 1412(.82153)>10 3. pop>10*n 3. pop>10(1412)
Exploratory Data Analysis • From our observations, we found that 18% of drivers were on their cell phones, while 82% were not • 252 drivers were on their cell phones • 1160 were not on their cell phones • We believe that the majority of people don’t use their cell phones while driving
1 Prop Z-Test Cont. • Ho: p=.2 • Ha: p>.2 • P(z>0.0462)=0.4816 • We fail to reject Ho because p-value is >α=0.05 • We have sufficient evidence that the observed number of drivers using their cell phones is close if not equal to the national average of .2
2 prop Z-test Assumptions State 2 Independent SRS Check Assumed .2118 x 656 = 138.94 .7882 x 656 = 524.28 .1495 x 756= 113.02 .8505 x 756 = 642.98 Pop > 6560 Pop > 7560
Exploratory Data Analysis • Overall females were on their phone more than males • We observed more males then females • 21% female, 15% male • We believe that females drive and use their cell phones more than males • Of the people driving on using their cell phones • 53%-car • 30%-SUV • 10%-truck • 7%-van
2 Prop Z-test cont. • We reject Ho because p-value<α=0.05 • We have sufficient evidence that the proportion of women driving while using their cell phones is greater than the proportion of men who drive and use their cell phones
Chi Squared Assumptions • 2 independent SRS • All expected counts are > 5 • 2 independent SRS • Assumed • Assumed
Chi Squared Test • Ho: there is no association between type of car and using a cell phone • Ha: there is an association between type of car and using a cell phone P(χ2>8.76/df=6)= .1873104
Chi Squared Test • We fail to reject Ho because p-value>α=0.05 • We have sufficient evidence that there is no association between type of car and using a cell phone • We believe that the type of car does not effect whether the driver uses their cell phone
Exploratory Data Analysis • Cell phone users were driving sedans more than other vehicles • Vans seemed to have lowest cell phone users • The intersection of 152 & County line road has the most cell phone users • We believe that more people drive sedans and use cell phones (than any other vehicle)
Lurking Variables Sources of error/bias • Time of day-morning, lunch hour, rush hour • Weather conditions- people may be more inclined to text when the weather is nice • Day of the week • Traffic conditions • Blue tooth • Tinted windows • Miscommunication • Not recording gender correctly • Manual or automatic
Personal Opinion • We enjoyed collecting the data • We expected more females to use their cell phones while driving, which was true based on our data • We didn’t expect people driving while playing psp or reading a book