Download
1 / 28
280 likes | 368 Vues
Learn how to generate reports on PADDS for CADI, SNAP-IV, and more. Easily view, print, and export data for analysis or sharing. Step-by-step guide with screenshots included.

E N D
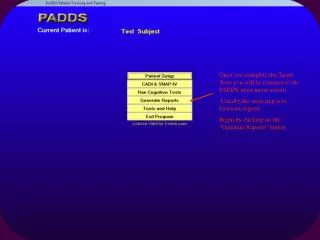
Once you complete the Target Tests you will be returned to the PADDS main menu screen. Usually the next step is to Generate reports. Begin by clicking on the “Generate Reports” button
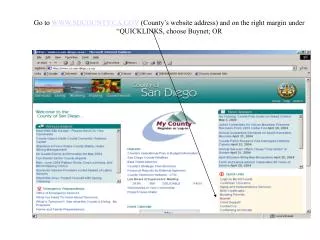
This screen comes up when you click on the “Generate Reports” button on the PADDS main menu . At this screen you can choose which reports to View, Print and export data to be used in other programs. The CADI report contains the screening information collected to help identify possible co-morbid conditions. The SNAP-IV Parent or Teacher behavioral rating scales for DSM-IV Criteria. The Target Tests & SNAP-IV Summary Report. Click on the appropriate button for the report you want to generate.
This is the first screen that comes up letting you know that the Report is being generated. It takes a few moments while the information is being processed to generate the reports. You will see this screen for each of the reports.
You will see this screen if you are trying to run a report for the Diagnostic Interview (CADI) and you haven’t completed one yet. Click on the “OK” button and go back to the PADDS main menu screen. Then click on the “CADI SNAP-IV” button to complete a CADI.
Click on the “Report for Diagnostic Interview (CADI)” button and your report will be generated if available. You can view, print or export the report.
We recommend using the CADI because it is an important primary screening for possible comorbid conditions that can mimic or exacerbate ADHD symptoms. The Computer Administered Diagnostic Interview (CADI) Summary Report covers items in the following domains Medical History/Systems Review Developmental History Social/Emotional Functioning; Depression/Anxiety Behavior School History
There are a total of 113 questions in the Diagnostic Interview (CADI). Depending on the answers given the report can be 3 to 6 pages long. Once the Diagnostic Interview (CADI) has been input you can also View and/or Edit existing records.
To export your reports click on the symbol on the Title Bar that looks like an envelope with a red arrow on it. In this example we are exporting a CADI, all the reports will export using the same steps. When you click on the envelope symbol it will bring up this Export dropdown list. You will scroll through the list until you find the type of file you want, for example pdf, rtf etc… When you click on the OK button it will bring up the following screen (next slide)
This screen is where you choose which pages you want to save. It defaults to save all pages, if you want to export a page range click on the “Page Range” radio button and enter your “From” and“To” pages then click the “OK” button.
This screen is where you choose where you want to save the file to. In this example the machine is running Vista and it shows that it is going to save it to your Windows Temp file. (other operating systems will look different). If you want to save it to a different location you will need to navigate to that location on your computer. At this screen you will also rename the file and navigate to the folder or other location you wish to save it to. All of your reports will export using the same steps as this example.
You may see this screen if you click on the export (envelope symbol on Title Bar) twice, this is a Microsoft Outlook issue, you can ignore it, this won’t affect the program use. Click on the “OK” button and continue.
You may view, print and export the individual SNAP-IV reports if you wish by clicking on the appropriate button here. Alternatively, summaries of the SNAP-IV reports are automatically included in the Cognitive Test Report as well.
This is an example of a SNAP-IV Report, to export it use the same steps described for exporting the CADI, see page 17 in the PADDS Installation and Use manual.
Click here to generate a report for the Cognitive Tests and the summarized SNAP-V Behavioral Ratings
You will see this screen if you try to run a Cognitive Test and SNAP-IV Report and you haven’t completed your SNAPS or the testing.
You will see this screen if you haven’t completed all 3 of the Target Tests and you are trying to generate a Target Tests and Summary report. Close this screen by clicking on the red“X”.Return to the PADDS main menu and Click on “Run Cognitive Tests” button to start the testing.
Choosing the “Report for the Cognitive Tests” button on the REPORTS screen you will be presented with this screen. Notice the flashing message “Analyzing Report Data”, once it is finished it will instruct you how to proceed. If you haven’t completed either SNAP-IV Form, then the check boxes for DSM-IV Criteria will be blank (unchecked). If you have the information from another source that meets the DSM-IV Criteria for ADHD, such as Brown Scales, Vanderbilt, etc… you would click to place a check in the appropriate box. The scoring program will automatically include the results for that measure in the end report.* It is important to note that only one behavioral rating scale from each source, (one Parent rating and one Teacher rating), can be included in the final score. * We recommend using the included SNAP-IV Ratings as they have superior psychometric utility and effect sizes.
Click on the date line to bring up the results for the tests that were completed on the date listed. If the child has completed more than one set of tests it will show up as multiple lines in the table here, sorted by dates. When multiple test sessions exist, clicking a date line uses the scores for that test date only, and brings up the nomogram and begins calculating likelihood ratios and final probabilities
This is the first screen that comes up when the program is generating this report. You will notice the Nomogram changes as the data is entered. (It takes a minute or two for the program to process all of the data.) Using the nomogram allows each data source to contribute toward (or detract from, as the case may be) the prediction of the diagnosis. The following screens show the progression of the data being entered.
We also use this bell curve to represent the Target Test results in standardized form for comparison. These scores are calculated on the subjects’ age at the time the tests were taken. The dashed lines are color-coded and indicate the respective cutoff points. Scores falling below these points are considered significant. We will describe these results and graphs in more detail in the following section on reports. This example shows the result with the Target Recognition raw score entered.
This example shows the result with the addition of the Target Sequencing raw score entered.
This example shows the result with the addition of the Target Tracking raw score entered. Click on the “RETURN” button to close the BELL CURVE.
Using the nomogram allows each data source to contribute toward (or detract from, as the case may be) the prediction of the diagnosis. These are the Target Tests scores. To print yourTarget Tests and Summary report Click on the “Printed Report” button. You will notice the Nomogram changes as the data is entered. (It takes a minute or two for the program to enter all of the data.) This example shows the nomogram with all fields entered. With a Pre-Test Probability of 76% a Likelihood Ratio of 1 and a Post-Test Probability of 76%.
The Cognitive Test Report includes: Summaries of the SNAP-IV data and Target Test Scores. All results are then combined using Bayesian Logic and graphed on a Fagan’s Nomogram. This gives a visual representation of the scoring process, (calculations normally done by hand), as well as a traditional standardized format for reference. These tools and reports, used together with sound clinical judgment, give the clinician a much more solid “Evidence Base” to consider when making an individual diagnosis.
If the SNAP-IV was used, the summary of that scoring appears on the first page with the subject’s demographic information.
An example of a Fagan’s nomogram being used to adjust the post test probability based on a calculated likelihood ratio of 10, applied to a beginning or pre-test probability of 74%. To do this by hand you would calculate the likelihood ratio using a formula similar to the one described below. You begin on the left side column with the pre-test probability expressed as a percentage (74%). Drawing a straight line to the center column at the point indicated by the likelihood ratio, 10 in this case, and continuing the straight line to the right column, in this case ending on 96%. The scoring paradigm creates an increment for each of the SNAP-IV rating scales and the 3 Target Test Scores, each of these increments will either add to or subtract from the final outcome. A nomogram graphic like this one is made for each step and placed in the report to show the incremental calculation of the probability based on each measure’s input.
The indicators on the bell graphic are age adjusted and color-coded to provide a quick, at a glance summary of the target test scores. The solid color lines fall on the percentile rank positions for each test raw score. The matching dashed lines indicate the 95% confidence cutoff points for that age group as seen in the cutoff table below. This graph can be helpful in situations where the overall probability is in an unexpected direction. The rule is any 2 out of 3 scores that fall below the respective cutoff points are considered clinically significant.
The Cognitive Test Report includes: Summaries of the SNAP-IV data and Target Test Scores. All results are then combined using Bayesian Logic and graphed on a Fagan’s Nomogram. This gives a visual representation of the scoring process, (calculations normally done by hand), as well as a traditional standardized format for reference. These tools and reports, used together with sound clinical judgment, give the clinician a much more solid “Evidence Base” to consider when making an individual diagnosis. Depending on the information provided, the report will be 4 or 5 pages in length.