Download
1 / 8
80 likes | 246 Vues
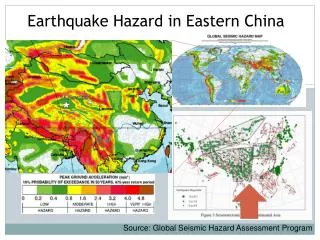
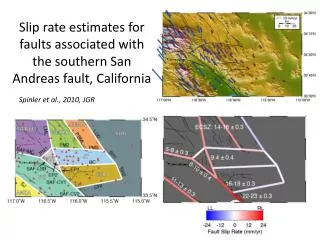
Geodetic and Geologic slip rate estimates for earthquake hazard assessment in Southern California. Ken Hudnut USGS March 30, 2001 University of Utah. North American and Pacific plate relative motions - is it 52 or 56 mm/yr? San Andreas fault zone

E N D
Geodetic and Geologic slip rate estimates for earthquake hazard assessment in Southern California Ken Hudnut USGS March 30, 2001 University of Utah Using Geodetic Rates in Seismic Hazard Mapping
North American and Pacific plate relative motions - is it 52 or 56 mm/yr? San Andreas fault zone - is it 22 mm/yr or 34 mm/yr along the Mojave segment? Eastern CaliforniaShear Zone • Estimated rates range between 6 and 12 mm/yr (geological & geodetic) • Is this difference in rates real? • Does it indicate elevated strain rate during a clustering of seismic (and aseismic) events? • Is the ECSZ energetically ‘easier’ than the Big Bend? Different path integrals yield differences Measuring rates by geology or geodesy are both difficult and prone to pitfalls Using Geodetic Rates in Seismic Hazard Mapping
SCEC crustal motion map • Combined EDM, VLBI, survey-mode and continuous GPS rigorously • Released as a SCEC product • Set the bar very high for the SCIGN project Using Geodetic Rates in Seismic Hazard Mapping
SCEC Crustal Motion Map - Version 3 • 315 GPS vectors added for a total of 678 vectors (version 2 had 363 vectors) • Early SCIGN site velocities now included • Version 3 will include time series for all stations Using Geodetic Rates in Seismic Hazard Mapping
from Tom Rockwell’s SCEC2 talk Generalized fault map of southern California with known slip rates circa 1990 Using Geodetic Rates in Seismic Hazard Mapping
Effects of lower crust viscosity on geodetic velocity field Borrowed from Brad Hager’s SCEC2 talk Rates may disagree the most where the lower crust is the weakest… ‘Spectacular’ Agreement In Carrizo Plain Weak lower crust => large variations in time early late Strong lower crust Using Geodetic Rates in Seismic Hazard Mapping
Examples of differences in rate • Garlock fault • Geologic rate 7 +/- 2 mm/yr • Geodetic rate 2 +/- 2 mm/yr • Geodesy < Geology => weak lower crust • Eastern California Shear Zone • Geologic rate summed over all faults is ~6 mm/yr • Geodetic rate across ECSZ is ~10–12 mm/yr • Geodesy > Geology => clustering or new higher tectonic rate? • Imperial Valley • Geologic rate of 20 mm/yr • Geodetic rate across valley of ~50 mm/yr => missing a major fault? • Sierra Madre – Cucamonga fault zone • Geologic rate of 0.5 mm/yr • Geodetic rate of a • Raymond fault • Geologic rate of 1.5-4 mm/yr • Geodetic rate of b • a + b ~ 6-8 mm/yr Using Geodetic Rates in Seismic Hazard Mapping
Conclusions • In the past decade, our understanding of rates has changed quite radically in So. Calif. – both in terms of geodetic and geologic estimates • Where we now think there are differences, it is important to confirm the observations and then attempt to explain the differences • Possible to explain these differences in a variety of ways • Bad data (e.g., missing a fault, off-fault deformation, etc.) • Bad modelling (e.g., dipping fault & layered structure, or variable strength modelled as elastic half-space) • Weak lower crust or strong lower crust (earthquake cycle) • Hypothesis testing approach needed where rates differ • Don’t assume geologic rate to be correct as a default position Using Geodetic Rates in Seismic Hazard Mapping