Download
1 / 24
250 likes | 474 Vues
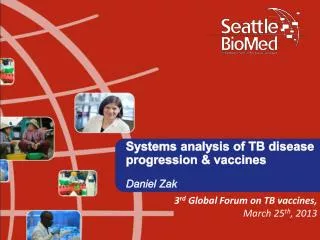
Systems analysis of TB disease progression & vaccines Daniel Zak. 3 rd Global Forum on TB vaccines, March 25 th , 2013. Systems analysis of TB disease progression & vaccines. Enhance vaccine development through systems analysis of clinical studies (reverse translation)

E N D
Systems analysis of TB disease progression & vaccinesDaniel Zak 3rd Global Forum on TB vaccines, March 25th, 2013
Systems analysis of TB disease progression & vaccines • Enhance vaccine development through systems analysis of clinical studies (reverse translation) • Identify biomarkers to predict functional responses • Generate hypotheses about mechanisms • Two case studies • 1- Correlates of TB disease risk in adolescents • 2- Comparative analysis of protein+adjuvant vaccines in NHP
Case study #1 Correlates of TB disease risk in adolescents • Collaboration with SATVI / University of Cape Town : Willem Hanekom (PI) • Identify prospective RNA signatures that discriminate M.tbinfected adolescents who progress to TB disease from the M.tbinfected adolescents who do not progress • The samples are from the Adolescent Cohort Study (ACS) • 6,363 adolescents, aged 12-18 years, followed-up for 2 years ~50% latently infected at enrollment TB infected (TST > 10mm or Quantiferon Gold) ~0.5% case rate Training dataset • 288 samples (35 cases, 65 controls at 1-4 time points) • Whole blood RNA-Seq 30 million 50bp paired-end reads
Pairwise junction-pair ensemble biomarker Red = higher in cases Results of 5-fold crossvalidation 78% 7% 44% 45% 67% 71% 71% 65% Prediction accuracy Controls Over 2 yrs before TB 1.5-2yrs before TB 1-1.5yrs before TB 0.5-1yr before TB 0-0.5yr before TB Incident case Post-treatment
Pairwise junction-pair ensemble biomarker Red = higher in cases TB SERPING1 also identified in Berry et al., 2010 and Maertzdorf et al., 2011
Confirmation and validation of the biomarker • Confirmation by qRT-PCR • Fluidigm Biomark analysis of RNA-Seq cDNA libraries • Performed at Seattle BioMed (48X48) and UCT (96x96) • 2-fold cross-validation • Validation using independent incident case microarray datasets • Step 1: Parameterize the classifiers using the UK training set (Berry et al., 2010) • Step 2: Perform blind predictions on remaining cohorts (Berry et al., 2010; Bloom et al., 2012) GBP5 RNA-seq Prediction accuracy Controls Over 2 yrs before TB 1.5-2yrs before TB 1-1.5yrs before TB 0.5-1yr before TB 0-0.5yr before TB Incident case Post-treatment qRT-PCR
Confirmation and validation of the biomarker • Confirmation by qRT-PCR • Fluidigm Biomark analysis of RNA-Seq cDNA libraries • Performed at Seattle BioMed (48X48) and UCT (96x96) • 2-fold cross-validation • Validation using independent incident case microarray datasets • Step 1: Parameterize the classifiers using the UK training set (Berry et al., 2010) • Step 2: Perform blind predictions on remaining cohorts (Berry et al., 2010; Bloom et al., 2012) GBP5 RNA-seq Prediction accuracy Controls Over 2 yrs before TB 1.5-2yrs before TB 1-1.5yrs before TB 0.5-1yr before TB 0-0.5yr before TB Incident case Post-treatment qRT-PCR
Integrating WB transcriptomes and PBMC counts(See Adam Penn-Nicholson, Tuesday 11:44, Breakout I – Biomarkers) “NK” Adam Penn-Nicholson Tom Scriba Willem Hanekom UCT/SATVI Non-CD14 Non-CD3 Non-CD19 Non-DC
Correlations between transcriptomes and NK cell counts, in cases and controls NCAM1/CD56 Controls Cases Relative expression %NK cells in PBMC NK cells can restrict Mtb growth in macrophages (Millman et al., 2008) and cytokine-primed NKs can respond to extracellular Mtb (Portevin et al., 2012).
Correlations between transcriptomes and NK cell counts, in cases and controls NCAM1/CD56 KLRF1/NKp80 Controls Cases Relative expression Relative expression %NK cells in PBMC %NK cells in PBMC NK cells can restrict Mtb growth in macrophages (Millman et al., 2008) and cytokine-primed NKs can respond to extracellular Mtb (Portevin et al., 2012). NKp80 binding to monocyte AICL promotes mutual activation as well as cytotoxicity against myeloid malignancies (Welte et al., 2006).
Many NK efffector molecules exhibit impaired expression in TB cases compared to controls Green = higher in controls; Red = higher in cases
Most monocyte correlated genes exhibit case vs. control differences, and these include major inflammatory networks Controls Cases Significant case/control difference Not significant Red = higher in cases
Correlations between transcriptomes and monocyte counts, in cases and controls ALOX15B LILRB4/ILT3 Relative expression Relative expression %Monocytes in PBMC %Monocytes in PBMC ALOX15B promotes anti-inflammatory lipoxin (LXA4) production (Wuest et al., 2012), which is clinically relevant in TB (Tobin et al., 2012). Soluble and APC-expressed ILT3 induces anergy and Treg phenotype of naïve and primed CD4+ T cells (Suciu-Foca & Cortesini, 2007).
Case study #2: Modular analysis of protein+adjuvant vaccines in NHP How does innate signaling influence the adaptive response? Bob Seder & Joe Francica, NIH VRC
Modular analysis of adjuvant-induced innate immune responses (Hematopoietic Precursors) (Plasma cells) Inflammation (B cells) (Cytotoxicity) Interferon response UP T cells DOWN Lymphoid lineage (Neutrophils) Evaluate complex transcriptome responses in terms of “modules” - functionally associated gene sets that are coordinately regulated in other systems Myeloid lineage Module definitions updated from Chaussabel et al., 2008
Modular analysis of adjuvant-induced innate immune responses (Hematopoietic Precursors) (Plasma cells) Inflammation (B cells) (Cytotoxicity) Interferon response T cells Lymphoid lineage (Neutrophils) Myeloid lineage 24hrs post-vaccination
Modular analysis of adjuvant-induced innate immune responses (Hematopoietic Precursors) (Plasma cells) Inflammation (B cells) (Cytotoxicity) Interferon response T cells Lymphoid lineage (Neutrophils) Myeloid lineage 24hrs post-vaccination
Modular analysis of adjuvant-induced innate immune responses (Hematopoietic Precursors) (Plasma cells) Inflammation (B cells) (Cytotoxicity) Interferon response T cells Lymphoid lineage (Neutrophils) Myeloid lineage 24hrs post-vaccination (Ab responses: Joe Francica and Bob Seder)
Modular analysis of adjuvant-induced innate immune responses (Hematopoietic Precursors) (Plasma cells) Inflammation (B cells) (Cytotoxicity) Interferon response T cells Lymphoid lineage (Neutrophils) Myeloid lineage (Ab responses: Joe Francica and Bob Seder)
The HSF1 module correlates with Ab response magnitude Heat Shock Factor 1 (HSF1) Regulation-centric modules: Analyze coordinate expression of genes that are targets of the same transcription factors (InnateDB/CisRED) Peak midpoint titers (log10) after 4th shot Total IgG Log2(FC) HSF1 module expression
The HSF1 module correlates with Ab response magnitude Heat Shock Factor 1 (HSF1) MF59 Peak midpoint titers (log10) after 4th shot Total IgG Alum Log2(FC) HSF1 module expression
The HSF1 module correlates with Ab response magnitude Heat Shock Factor 1 (HSF1) Inouye et al., 2004 HSF1+/+ MF59 Peak midpoint titers (log10) after 4th shot Total IgG Alum HSF1-/- IgG2a and IgG1 production are impaired in HSF1-null mice (Sheep RBC model) Log2(FC) HSF1 module expression
Next steps • Validating TB disease risk biomarkers in independent samples (ACS) and cohorts (GC6) • Evaluating sorted cell transcriptomes from ACS • Functionally evaluating role of HSF1 and other predicted regulators in murine vaccine models • Future analyses of candidate TB vaccines (AERAS) • AERAS-422 (Dan Hoft) • M72 (GSK)
Thank you! Willem Hanekom Thomas Scriba Adam Penn-Nicholson Wendy Whatney Mzwandile Erasmus Alan Aderem Systems Vaccinology Team Ethan Thompson Lynn Amon Joe Valvo Emilio Siena (Novartis) Smitha Shankar Rebecca Podyminogin Bob Seder Joe Francica