Comparison of Batch and Continuous Productivities
30 likes | 231 Vues
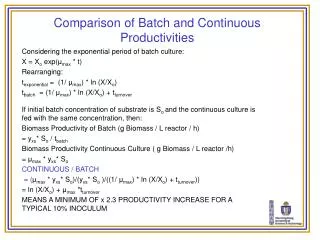
Comparison of Batch and Continuous Productivities. Considering the exponential period of batch culture: X = X o exp( μ max * t) Rearranging: t exponential = (1/ μ max ) * ln (X/X o ) t batch = (1/ μ max ) * ln (X/X o ) + t turnover

Comparison of Batch and Continuous Productivities
E N D
Presentation Transcript
Comparison of Batch and Continuous Productivities Considering the exponential period of batch culture: X = Xo exp(μmax * t) Rearranging: texponential = (1/ μmax) * ln (X/Xo) tbatch = (1/ μmax) * ln (X/Xo) + tturnover If initial batch concentration of substrate is So and the continuous culture is fed with the same concentration, then: Biomass Productivity of Batch (g Biomass / L reactor / h) = yxs* So / tbatch Biomass Productivity Continuous Culture ( g Biomass / L reactor /h) = μmax * yxs* So CONTINUOUS / BATCH = (μmax * yxs* So)/(yxs* So )/((1/ μmax) * ln (X/Xo) + tturnover)) = ln (X/Xo) + μmax *tturnover MEANS A MINIMUM OF x 2.3 PRODUCTIVITY INCREASE FOR A TYPICAL 10% INOCULUM