Download
1 / 19
190 likes | 381 Vues
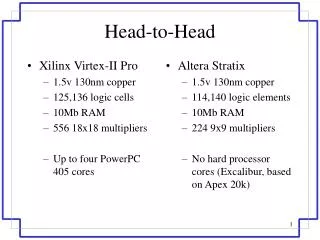
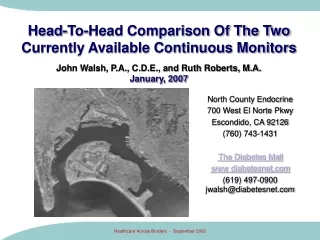
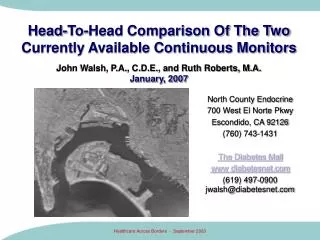
Head-To-Head Comparison Of The Two Currently Available Continuous Monitors. John Walsh, P.A., C.D.E., and Ruth Roberts, M.A. January, 2007. North County Endocrine 700 West El Norte Pkwy Escondido, CA 92126 (760) 743-1431 The Diabetes Mall www diabetesnet.com

E N D
Head-To-Head Comparison Of The Two Currently Available Continuous Monitors John Walsh, P.A., C.D.E., and Ruth Roberts, M.A. January, 2007 North County Endocrine 700 West El Norte Pkwy Escondido, CA 92126 (760) 743-1431 The Diabetes Mall www diabetesnet.com (619) 497-0900 jwalsh@diabetesnet.com Healthcare Across Borders - September 2003
Dexcom STS Monitor FDA release 3/27/06 Approved for 18 and older Readings every 5 min. 3-14 days of readings per sensor One high and two low alerts $800 (often less) + $35 per “3” day sensor Transmitter replacement: ~$250 every 6 mos Transmitter ~0.8 x 1.5” Healthcare Across Borders - September 2003
Medtronic Paradigm RT Trend arrows Readings every 5 min. $999 + $35 per “3 day” sensor Transmitter replacement: ~$900 every 6 mos FDA release: 4/13/06 Paradigm 522/722 pump Sensor connected to transmitter by wire Approved for 18 and older One high and one low alert NOT a closed loop Healthcare Across Borders - September 2003
Continuous Monitors Compared The Dexcom STS & Paradigm RT continuous monitors are currently available in the U.S. This study was designed as a head to head comparison while being worn by one person with Type 1 diabetes. An Ultra meter was used as the standard against which each monitor’s accuracy was tested. Each monitor’s screen is shown above over the same 3 hour time span over a glucose range of 0 to 400 mg/dl. The Ultra meter reading at the time read 73 mg/dl compared to 93 and 122 mg/dl. Healthcare Across Borders - September 2003
Research Design • The low alert in each monitor was set at 80 mg/dl and the high alert at 160 mg/dl • 262 readings from an Ultra meter were performed over 33 days (7.94 tests per day) • Simultaneous readings from each monitor were compared to the Ultra’s readings • Testing with the Ultra meter was performed: • As soon as either monitor’s low or high alert sounded • When values between the monitors disagreed • And at routine intervals, including calibrations Healthcare Across Borders - September 2003
Calibrations • Each monitor required 2 calibrations with an Ultra glucose meter each day to reduce “drift” or loss of accuracy over time. • Calibrations were generally done when the glucose level was stable. • Calibrations were usually done on both monitors when requested by one of them. • In all, 3 to 4 calibrations were done per day on both monitors. • Care was taken not to do more than 4 calibrations per day on either monitor due to the recommendation by one of the manufactures that no more than 4 be done per day. (This recommendation makes no sense to us, though we have discussed it with various engineering and sales personnel from the company.) • Accuracy of the other monitor appears to improve when more calibrations are done from observations before and after the study. Healthcare Across Borders - September 2003
Readings Sorted By Ultra BG Values Sorted By Consecutive Readings Minor note: Sensor B always gives results in even numbers for reasons we do not understand. However, an odd number would sometimes result when a second reading was displayed before the Ultra test was complete and the two readings were averaged. Red = first to detect a low Yellow = first to detect a high Purple = over 50 mg/dl off Healthcare Across Borders - September 2003
Readings Sorted By Ultra BG Values Low to High High to Low Red = first to detect a low Yellow = first to detect a high Purple = over 50 mg/dl off Healthcare Across Borders - September 2003
Plotted Readings With Trend Lines A Ultra Monitor A shows linearity from 50 mg/dl up to at least 240 mg/dl. Monitor B shows more scattered values and “flattens out” with higher low readings and lower high readings than the Ultra. B Ultra Healthcare Across Borders - September 2003
GlycensitTM Analysis • Blue dotted lines = ISO standards • Yellow area = where 95% of data points will fall • Red lines = minimum and maximum deviation by star points • Ideally, all readings would fall between the blue dotted lines -- this is the standard for today’s glucose meters B A http://tomcatbackup.esat.kuleuven.be/GLYCENSIT/ Healthcare Across Borders - September 2003
Monitor Accuracy • Table shows how much each monitor’s glucose values differed from a simultaneous reading on the Ultra meter. 19.8% 23.7% 17.6% 13.7% 10.3% 5.3% 2.7% 6.9% 44.3% 31.7% 12.2% 4.2% 3.4% 1.5% 0.8% 1.9% 43.5% 41.6% 14.9% 76.0% 19.8% 4.2% Healthcare Across Borders - September 2003
Monitor Accuracy Monitor A read slightly high (5%) for readings below 80, while B’s readings were 34% high for this range. Between 81 and 160, both sensors were within 3% of the Ulta. Between 161 and 240, A averaged 3% lower than the Ultra, while B averaged 17% lower. Above 240, there are too few readings to judge accuracy, but both monitors appear to read lower, although the difference was more pronounced for Monitor B. Healthcare Across Borders - September 2003
Monitor Accuracy B A Lower than the Ultra Higher than the Ultra BGs < 80 BGs 80-160 BGs > 160 BGs < 80 BGs 80-160 BGs > 160 This GlycensitTM graphic summarizes data shown on the previous slide. The average reading for Monitor A, shown by the middle of the spool-shaped objects for low, middle, and high, is much closer to that of the Ultra meter (the green line in the middle) with less variation (the height of the spool the standard deviation) than Monitor B. The shorter the spool and the closer it’s middle is to the line the more accurate the Monitor. http://tomcatbackup.esat.kuleuven.be/GLYCENSIT/ Healthcare Across Borders - September 2003
Which Monitor Alerted First? • One of the most important functions of a continuous monitor is to accurately warn of low and high readings. This table shows which monitor alerted at least 5 min earlier for lows and highs. • Monitor A was first to alert for a reading below 80 mg/dl 76% of the time, Monitor B was first 3% of the time, and 21% were ties. • For detection of highs above 160, Monitor A was first 68% of the time, Monitor B was first 5% of the time, and 27% were ties. Healthcare Across Borders - September 2003
Time Advantge For First Alerts * Time not recorded for 2 of these events ** Time not recorded for 4 of these Healthcare Across Borders - September 2003
Time Delays For Low And High Alerts • In situations where Monitor A was first to alert*, the time delays for Monitor B to give an alert are shown. • * confirmed with the Ultra meter • ** Readings were maintained below 80 mg/dl for long periods to test these delays. Healthcare Across Borders - September 2003
Problems Needing Answers To Close The Loop • Sensor inaccuracy • Not reliable • Slow insulin • Lifestyle variability • No control algorithm • Sensor lag time • Insulin overdose Insulin Glucose Engineering / Materials Internal Checking Viaject / Oral insulin Rapid Prediction Software / Testing Engineering Dual delivery / Glucagon Healthcare Across Borders - September 2003
Findings • Neither continuous monitor has any hope for use in a closed loop system at this time, especially Monitor B. • In our single case study, Monitor A when compared with Monitor B was noticeably: • More accurate • Quicker to detect changes in glucose • Quicker to warn of low and high glucose readings • Monitor B was slower to respond to changes in glucose and tended to have “flat” readings that were more likely to read high for lows and low for highs. • This study involved only one individual, so each monitors may perform differently in others. • Additional head-to-head comparisons of different continuous monitors are recommended. Healthcare Across Borders - September 2003
Addendum • To eliminate a possible equipment problem as the cause for poor accuracy with Monitor B, two different transmitters and receivers were used over two different periods. The first combo was used for 19 days in late September and early October of 2006, and the second for 14 days in December, 2006. This change of equipment did not improve accuracy. • Sensors for both monitors have been shown to maintain accuracy when used longer than 3 days. Over the 33 days of the study, 6 different sensors were used for Monitor A and 9 sensors were used for Monitor B. This had no impact on accuracy. • Two sensors (one for each monitor) were replaced within a few hours of each other in late September after 4 bad readings (over 50 mg/dl off) were received from each. These readings were also included with no real effect on overall accuracy. Healthcare Across Borders - September 2003