Download
1 / 74
750 likes | 916 Vues
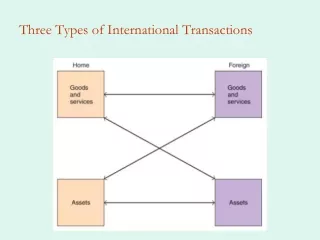
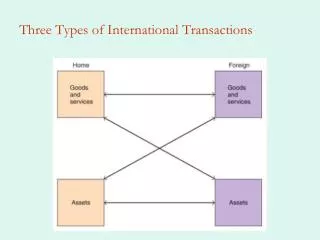
Three Types of International Transactions. Three Types of International Transactions. Goods for Goods is straight trade Goods for assets is intertemporal trade

E N D
Three Types of International Transactions • Goods for Goods is straight trade • Goods for assets is intertemporal trade • The theory of intertemporal trade describes the gains from trade of goods and services for assets, of goods and services today for claims to goods and services in the future (today’s assets). • Assets for assets is portfolio diversification • The theory of portfolio diversification describes the gains from trade of assets for assets, of assets with one type of risk with assets of another type of risk.
Portfolio Diversification • Gains from portfolio diversification are large • This explains why asset trade is so large • Gains from international sharing of risks • This makes economies more interdependent than even trade relations • Important mechanism for transmitting shocks cross countries • Important in the current financial crisis • We consider a simple model with one good but two states • This is characterization of uncertainty. For example, it could rain or be sunny. Agents have expectations about these states. By trading they can hedge some risks.
Portfolio Diversification • Consider a two-country, two-period endowment economy (one good, yi) with two states of nature: • Let • For example, the probability that harvest is good • So with only two states, we have • Thus in each country the endowment is stochastic • Assume risks are not perfectly correlated across countries • Assume identical agents in each country are risk averse • Then, if contracts can be enforced, there are gains from trade
Expected Utility • Agents maximize expected utility • Preferences are state-dependent • What is the budget constraint? • If no trade then there is no choice to make • ci = yi for each state i • Suppose a country can buy (sell) an asset (bi) that pays off in case state i occurs • Let pi be the price of this asset (where does this come from?) • Expected consumption is now
Gains from trade • Would agents be willing to pay for these claims? • Yes, if they are risk averse • Risk averse agents are willing to sacrifice some income for certain income • Suppose that in country A, • And in country B, • And we suppose that people know the • Then for some p there will be gains from trade • Country A will deliver b1 of the good if state 1 occurs • Country B will deliver b2 of the good if state 2 occurs
Implications • International risk sharing makes both countries better off • This is just insurance • Result depends on risk aversion • Notice that we have derived a motive for capital flows, even though • There is only one good • There is only one time period • How is contract enforced?
Extent of Portfolio Diversification • In 1999, US owned assets in foreign countries represented about 30% of US capital, while foreign assets in the US was about 36% of US capital. • These percentages are about 5 times as large as percentages from 1970, indicating that international capital markets have allowed investors to increase diversification. • Likewise, foreign assets and liabilities as a percent of GDP has grown for the US and other countries.
Home Bias • Investors hold too large a share of portfolio in domestic assets • In principle investors should hold domestic assets in proportion to size of the economy • In practice, much less international diversification • Costly in terms of return and risk; analyze using efficiency frontier • Why is there home bias? • Transaction costs seem too small • Perhaps information asymmetries • Imperfect capital market integration? • Home bias seems to be decreasing over time • But it is has not gone away!
Efficiency Frontier • Suppose we have two assets, A and B • Asset A has lower risk and lower expected return • Asset B has higher risk and higher expected return • Suppose that returns are not perfectly correlated • => a diversified portfolio will generate higher expected return and lower risk • As we add asset B to the portfolio, ER rises and risk falls • Eventually diversification offset by higher risk (point C) • So we obtain the efficiency frontier
Digression • Easy step from Efficiency frontier to the Capital Asset Pricing Model (CAPM) • Workhorse idea of finance • Use Tobin Separation Theorem • Add risk-free asset (T-bills) to investor’s choices • Investor divides wealth between T-bills and a portfolio of risk assets on the efficiency frontier • To learn about the CAPM click here.
Tobin Separation Theorem • Consider an agent more risk averse than in previous slide • Indifference curve will be tangent to the CAL to the southwest of point C. But it will still be on CAL • So agent will hold more cash and less of P, but all risky assets will still be portfolio P • Indeed, all agents hold the same portfolio of risky assets. They hold different shares of risky and risk-free assets, but not different portfolios of risky assets!
Risk and Return • How does diversification reduce risk? The key is covariance • Suppose we have two assets, y and z, and suppose that their weights are a and b • The variance of the returns are given by: • Notice that if there is no benefit: • So, if it follows that • Thus, when assets are not perfectly correlated diversification reduces risk
Home Biasmean return and std dev (1970-1996) for SP 500 and Morgan Stanley EAFE fund 39% foreign
Can there be too much risk sharing? • Risk sharing enables consumption smoothing • Marginal benefits are positive • Possibilities are endless given derivatives • Swaps, options and other ways to insure • Many bets are made with leverage • Banks and financial institutions are often too big to fail or federally insured • Moral hazard • Implies social cost of insurance could be greater than private cost
Current Account: Intertemporal Framework • Huge US current account deficit • Current account balance is the record of a country’s current transactions with the rest of the world • Why do we care? • Because debts must be paid back => lower future consumption • Perhaps via lower exchange value of the dollar • A current account deficit means a decline in net foreign assets • That is why the US net international position has deteriorated
Current Account Balancebillions of dollars, seasonally adjusted at annual rates
Current Account in an Intertemporal Framework • Consider a small economy with identical consumers. • Consumption is chosen to maximize: • Income in each of the two periods is given, so budget constraint is: • Optimal consumption when: • Or • Marginal rate of substitution = relative price
Autarky • Notice that if then consumption would be equal across periods. • Call this interest rate, ra, the autarky interest rate • Notice that if r = ra then so c1 = c2 • if r < ra then so c1 > c2 (and vice versa) • So if r < ra (interest rates very low) consumption is decreasing over time (and vice versa) • The notion of an autarky rate will be useful later
Current Account • From NIA we have Y = C +NX • If Ci ≠ Yi we have borrowing and lending, NX≠ 0 • Let At be net foreign assets in time t, (A0 = initial assets) • The budget constraint is thus: • Second period consumption is • Second period CA surplus = First period CA deficit plus interest on the debt, plus initial assets • We can define the current account as net exports plus net interest payments: CA ≡ NX + rA
More current account • Since there are only two periods the CA in period two equals NX in period two, or: • So we can write • PV of future surpluses = the initial level of debt • No free lunch
Longer Time Horizon • What if there are more than two periods? • No problem. Start with definition of CA: • So I can write • which must be true for any period, so • or
Longer time horizon (cont.) • Now just substitute for At+1 • And if I repeat the process: • And again, • We just keep pushing the last term, terminal assets further and further into the future
Longer time horizon (cont.) • We can write it compactly as • As T gets very large the last term goes to zero • Why? No Ponzi schemes, and no wasted wealth. • So, • PV of future NX equals (negative) initial level of assets
Implications • If we start life NA > 0, we can consume more than we earn over our lifetimes (in pv) • i.e., PV of NX < 0 • If we start with net debt, we are going to have to produce more than we earn over our lifetimes (in pv) • i.e., PV of NX > 0 • So negative US NFA today means that we will have to run future current account surpluses • This is a very weakconstraint!
Adding Investment • Now suppose a country can invest • Production function F(K), with return = • But diminishing returns • How to raise K? By investing today • Suppose endowment is at A in figure • Present value of production maximized at P* • Marginal rate of technical substitution = 1+r • First period investment = • If economy closed then consumption choices must be along BA in figure • What if small open economy facing r*? • Production and consumption decisions are separated
Implications • With open capital markets, production at P* and consumption at C* • Notice that C* is outside the closed economy consumption possibilities set • Consumption in period one is greater than production • Current account deficit in period one = • In period two we pay back, as • What if there were initial debt?
Investment and the Current Account Balance • Now two ways to hold wealth: I and K • Capital stock evolves according to • So the change in domestic wealth is • Thus, domestic wealth increases (sometimes called accumulation) only if earnings exceed spending on consumption (government included). • Using the capital stock equation and the definition of the current account we can rearrange to obtain:
Current Account with Investment • Using the definition of savings (1) • Then Net Exports is given by (2) • notice this is NX not CA on the LHS of (1) because we do not have net interest income on the RHS of (1). • Thus, national saving in excess of domestic capital formation flows into net foreign asset accumulation. • => the current account is fundamentally an intertemporal phenomenon. • Example: Norway discovers oil
Two-Country Model • Small country model takes r as given • To determine r we use the two-country model • Key point is that world savings = 0, or • So • This implies that the equilibrium world interest rate must be fall between the autarky interest rates of the home and foreign country
Equilibrium world interest rate: a decrease in foreign savings
Missing world savings • World current account balances must sum to 0 • But they don’t • Why? • Proof of life elsewhere in the universe? • Statistical discrepancies • But why is it a missing surplus? • Timing • Does not explain missing surplus • Misreporting of interest income • Explains the relation to world interest rates • Also non-reporting of maritime freight earnings