Download
1 / 15
150 likes | 291 Vues
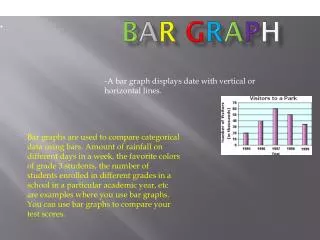
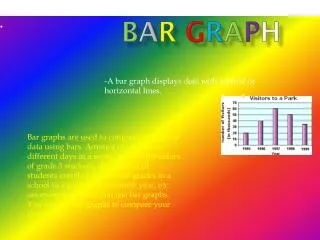
Bar Graph. B a r G r a p h. -A bar graph displays date with vertical or horizontal lines.

E N D
Bar Graph BarGraph -A bar graph displays date with vertical or horizontal lines. Bar graphs are used to compare categorical data using bars. Amount of rainfall on different days in a week, the favorite colors of grade 3 students, the number of students enrolled in different grades in a school in a particular academic year, etc are examples where you use bar graphs. You can use bar graphs to compare your test scores.
Line Plot • Use a number line and X’s • A line graph is often used to represent a set of data values in which a quantity varies with time • These graphs are useful for finding trends. • That is, finding a general pattern in data sets including temperature, sales, employment, company profit or cost over a period of time. Solved Example on Line Graph Irena recorded her test scores in a line graph as shown. What is Irena's score on the Math test? Choices: A. 50 B. 80 C. 60 D. 40 Correct Answer: C Solution: Step 1: The height of each point in the line graph represents Irena's score on the particular test. Step 2: Note the height of the point representing Irena's score on the Math test. Step 3: The height of the point is 60. Step 4: So, Irena scored 60 on the Math test.
Histogram • The histogram is a summary graph showing a count of the data points falling in various ranges. The effect is a rough approximation of the frequency distribution of the data. Example 1:The histogram below shows the heights (in cm) distribution of 30 people. a) How many people have heights between 159.5 and 169.5 cm? b) How many people have heights less than 159.5 cm? c) How many people have heights more than 169.5 cm? d) What percentage of people have heights between 149.5 and 179.5 cm?
LineGraph*_* . Shows datathat changes over time . Example 1.
Stem And Leaf plot • Shows data arranged by place value ( Hint : 2/2=24) The "stem" is the left-hand column which contains the tens digits. The "leaves" are the lists in the right-hand column, showing all the ones digits for each of the tens, twenties, thirties, and forties. As you can see, the original values can still be determined; you can tell, from that bottom leaf, that the three values in the forties were 40, 40, and 41.
CircleGraph • Shows parts of a whole . Examples of Circle Graph In the example shown below, the circle graph shows the percentages of people who like different fruits. Each sector in the circle graph represents the percentage of people liking the respective fruit.
Scattered Plots • Is a graph with points plotted to show a relationship between to sets of data Let's decide if studying longer will affect Regents grades based upon a specific set of data. Given the data below, a scatter plot has been prepared to represent the data. Remember when making a scatter plot, do NOT connect the dots.
Associative property • When adding or multiplying three numbers, it doesn't matter if the first two or the last two numbers are added or multiplied first. • For example : 3 + 9 + 7 = (3 + 9) + 7 = 3 + (9 + 7) 12 + 7 = 3 + 16 19 = 19 3 x 9 x 7 = (3 x 9) x 7 = 3 x (9 x 7) 27 x 7 = 3 x 63 189 = 18
Commutative property • Numbers can be added or multiplied in either order. • For example : 15 + 9 = 9 + 15; 3 x 8 = 8 x 3.
Distributive property • Property indicating a special way in which multiplication is applied to addition of two (or more) numbers. • For example, 5 x 23 = 5 x (20 + 3) = 5 x 20 + 5 x 3 = 100 + 15 = 115.
Exponential function • Showing place value by multiplying each digit in a number by the appropriate power of 10. • 523 = 5 x 100 + 2 x 10 + 3 x 1 or 5 x 10² + 2 x 101 + 3 x 100
Integers • The set of numbers: • For Example {..., -6, -5, -4, -3, -2, -1, 0, 1, 2, 3, 4, 5, 6,...}
Mode • The most frequently occurring value in a set of data • For example, the mode of the set {13, 5, 9, 11, 11, 8, 10} is 11
Median. • The middle value of an ordered set of numerical data. • For example, the median value of the set {5, 8, 9, 10, 11, 11,13} is 10.
Variable • A quantity that may assume any one of a set of values. Usually represented in algebraic notation by the use of a letter • y = 2x + 7, both x and y are variables.