Download
1 / 33
330 likes | 490 Vues
The Impact of Liquidity on Option Prices. Robin K. Chou Department of Finance, National Chengchi University San-Lin Chung and Yaw-Huei Wang Department of Finance, National Taiwan University Yu-Jen Hsiao Department of Finance, National Central University. Introduction.

E N D
The Impact of Liquidity on Option Prices Robin K. Chou Department of Finance, National Chengchi University San-Lin Chung and Yaw-Huei Wang Department of Finance, National Taiwan University Yu-Jen Hsiao Department of Finance, National Central University
Introduction • Standard asset pricing theory • market is frictionless thus liquidity is not priced • Market microstructure literature • liquidity factors are important determinants of stock and bond returns • returns have been found to be affected by liquidity, as measured by the bid-ask spread (Amihud and Mendelson, 1986a, 1991), the price impact of trades (Brennan and Subrahmanyam, 1996), and volume or turnover ratio (Datar, Naik, and Radcliffe, 1998).
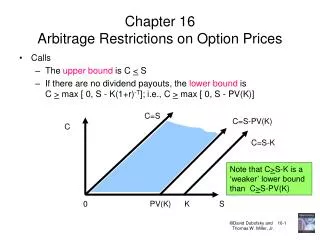
Introduction • Most of the prior studies focus on examining the effects of liquidity on stock and bond prices. • Only few articles examined the effects of option liquidity on the pricing of options • Brenner, Eldor, and Hauser (2001) • Bollen and Whaley (2004) • Garleanu et al. (2009)
Introduction • Since options are contingent assets, the liquidity of the underlying asset is also of relevance to the pricing of options. • Frey (1998) • Cho and Engle (1999) • Frey (2000) and Liu and Yong (2005) • Cetin et al. (2006)
Introduction • This study examines the liquidity effect on option prices from both the spot and option markets. • Data: individual stock options of 30 component firms in the Dow Jones Industrial Average (DJIA) index. • Trade-based measures include ‘cumulative trading volume’ (VOL), ‘number of trades’ (NT), and ‘average trade size’ (ATS). • Order-based measures include ‘absolute order imbalance’ (AOI), ‘average proportional quoted spread’ (AQS), and ‘average proportional effective spread’ (AES).
Introduction • Option liquidity measures include ‘trading volume’ based upon the overall number of contracts (OVOL), ‘option proportional bid ask spread’ (OAQS), ‘dollar trading volume’ (DVOL), and total option ‘open interest’ (OI). • Main findings • After controlling for the systematic risk of Duan and Wei (2009), as well as other control variables, we find a clear link between the pricing of options and liquidity.
Introduction • Main findings • Options with a lower proportional bid-ask spread have a higher level of model-free implied volatility. This finding is consistent with the ‘illiquidity premium’ hypothesis proposed by Amihud and Mendelson (1986a) • Options become more expensive when the spot asset is less liquid, which is consistent with the findings of Cetin et al. (2006)
Introduction • Main findings • The liquidity of options can partly explain the implied volatility ‘smile’ documented by Rubinstein (1985) and others. When the option market becomes more liquid (i.e. when there is a lower option proportional bid-ask spread), the implied volatility curve becomes steeper (more negatively skewed).
Data • Options written on 30 component firms in the DJIA index are collected from Ivy DB OptionMetrics. • We use the standardized volatility surfaces, provided by OptionMetrics, with four different time-to-maturity periods (30, 60, 91 and 182 days) for each stock and for each trading day. • The spot liquidity data is obtained from the Center for Research in Securities Prices (CRSP) and the Trades and Quotes (TAQ) database.
Variable Measures • Dependent variables • We use the option prices of all out-of-the-money options to calculate -period ‘model-free implied volatility’ as:
Variable Measures • Independent variables • Spot liquidity measures
Variable Measures • Independent variables • Option liquidity measures
Variable Measures • Independent variables • Control variables
Empirical Results • Summary statistics are reported in Table 2 and the correlations between the variables are reported in Table 3. • We first examine the effect of each liquidity proxy on MFIV of options. The results are reported in Table 4. • Models (1) and (2) of Table 4 confirm that the chosen control variables are priced in option market • Models (3) to (12) of Table 4 suggest that both the spot and option liquidity levels are priced in option market
Empirical Results • We next test the effect of the most significant liquidity proxies on MFIV of options simultaneously. The results are reported in Table 5. • Three most significant spot liquidity proxy variables (VOL, ATS, and AQS) and the three most significant option liquidity measures (DVOL, OAQS, and OI) are simultaneously included into a regression model with the six control variables. • Among all of the spot liquidity proxies, the average of the AQS coefficients is still found to be highly and positively significant, whereas the averages of the VOL and ATS coefficients are not significant.
Empirical Results • For the option liquidity measures, the coefficient averages of all option liquidity proxies are significant at below the 1 per cent level. Moreover, the cross-sectional proportion of OAQS with significance is found to be the highest, at 70 per cent. • The findings of Tables 4 and 5 imply that low spot liquidity leads to high option prices, with options becoming less expensive when the options market becomes more illiquid; this is consistent with the hedging cost explanation provided by Cetin et al. (2006) and the ‘illiquidity premium’ hypothesis of Amihud and Mendelson (1986a).
Empirical Results • To mitigates the concern that our results may depend on the time to maturity of options, we also compile all of the option-related data for the 60-, 91-, and 182-day maturity periods, and then rerun all of the tests in Table 5. The results are reported in Table 6. • Our empirical findings are robust across maturity periods with AQS and OAQS being found to be the most robust liquidity measures.
Empirical Results • Finally, we follow Duan and Wei (2009) to do the Level and Slope effect tests. We propose the following four testable hypotheses: • Hypothesis 1a: The level of the implied volatility curve is unrelated to the level of spot liquidity. • Hypothesis 1b: The level of the implied volatility curve is unrelated to the level of option liquidity. • Hypothesis 2a: The slope of the implied volatility curve is unrelated to the level of spot liquidity. • Hypothesis 2b: The slope of the implied volatility curve is unrelated to the level of option liquidity.
Variable Measures Dependent variables In this study, the level and slope of the implied volatility curves are defined as follows:
Empirical Results • We perform the following month-by-month cross-sectional regression to test Hypotheses 1a and 1b. • The results reported in Panel A of Table 7 confirm those of Duan and Wei (2009), who note that after controlling for stock-specific total volatility, the implied volatility level is significantly and positively related to the systematic risk proportion of the underlying stock.
Empirical Results • Panel B of Table 7 reveals strong evidence for the rejection of Hypotheses 1a and 1b, with the effect of spot and option liquidity on the implied volatility level remaining significant at the 1 per cent level, even after controlling for the influence of risk-neutral skewness, kurtosis, and the systematic risk proportion.
Empirical Results • We also perform the following month-by-month cross-sectional regression to test Hypotheses 2a and 2b. • Panel A of Table 8 supports the findings of Duan and Wei (2009) that the slope of the implied volatility curve is related to the systematic risk proportion, although not all of the coefficients are found to be statistically significant.
Empirical Results • Panel B of Table 8 provide strong evidence for the rejection of Hypothesis 2b; that is, they demonstrate that the slope of the implied volatility curve is also related to option liquidity. • Finally, no conclusive relationships are discernible between the implied volatility curve slope and spot liquidity (i.e., under most cases,is not found to be significant).
Conclusions • We found that with a reduction in spot liquidity, there is a corresponding increase in the model-free implied volatility. • We also found that an increase in option liquidity leads to a corresponding increase in the model-free implied volatility.
Conclusions • This study shows that the level of the implied volatility curve can be explained by both the spot and option liquidity. • This study shows that the slope of the implied volatility curvecan be explained by the option liquidity, but not by the spot liquidity.
Table 3 Correlation matrix of the cross-sectional means of the time series variable coefficients
Table 4 Regression results of model-free implied volatility on liquidity proxy variables
Table 5 Regression results of model-free implied volatility on selected liquidity proxies, 2001-2004
Table 6 Regression results of model-free implied volatility on selected liquidity proxies for various maturity periods