Download
1 / 51
510 likes | 751 Vues
Accuracy of PCA for Cancer detection applied to micro array data. by Nasser Abbasi Project supervisor: Dr C.H. Lee Mathematics department, CSUF. Goal of the study.

E N D
Accuracy of PCA for Cancer detection applied to micro array data by Nasser Abbasi Project supervisor: Dr C.H. Lee Mathematics department, CSUF
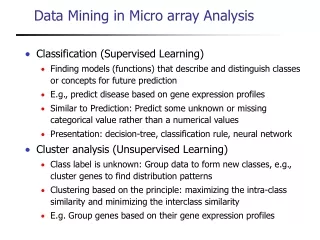
Goal of the study • Apply a mathematical technique for pattern recognition called Principal Component Analysis (PCA) to the detection of primary liver and bladder cancer using actual medical micro array data obtained from public databases such as Stanford SMD and NCBI GEO. • Evaluate accuracy of PCA in detection of primary liver and bladder cancer.
Phases of using PCA • The first phase: Called the training phase. We use PCA to obtain the dominant signal from a collection of signals. This collection of signals will be called the PCA working set. The dominant signal is the one which correlates the most with all the signals in the working set. This signal will be called the eigensignal. • The second phase: Called the detection phase. Determine the projection of the input signal against the eigensignal. Is the projection positive or negative? How large is the projection? • Validate result for accuracy: Knowing the correct type of the input signal, determine the accuracy of the detection phase.
Before going into the details of the project and the mathematics of PCA, we take a 2 minutes break and give a short introduction about DNA and Genes
Why genes are important Central dogma of molecular biology DNA makes RNA makes Protein http://phschool.com/science/biology_place/biocoach/imagestranslation/centdogtl.gif
Genes are special regions in DNA • Each human cell contain 46 chromosomes. • Each chromosome is of different length. • Total of 3 billion base-pairs in the DNA spread among the 46 chromosomes. • A Gene is special region in the DNA which is able to encodes protein
Some facts about DNA • DNA is the main central molecule from which all the cell functions originate. • Each human cell contain the same DNA. • Each human cell contain about 3 billion base pairs, which are spread out in 46 different chromosomes. • The chromosomes are not all the same size, some are much longer than others. There are 6 billion nucleotides in each human cell. (each base-pair is 2 nucleotides). • When a human cell divides and new cell is created, a new 6 billion nucleotides are made in the process. • The human body contain large amount of cells, some estimate is at 100 trillion cells. Hence the human body contain in it 100 trillion times 6 billion nucleotides or 600,000,000,000,000,000,000,000 nucleotides.
Genes and cancer • Cancer occurs when human cells divide and duplicate without control. In a normal cell, specific protein and enzymes control the life cycle of a cell by controlling the production of new cells. Since each specific protein is made by specific gene(s), knowing which genes are on or off in a cancerous cell, and how active that gene is gives an indication of the gene role in the cancer. • By obtaining a sample from part of the body which is known to have cancer, and if by some process we are able to determine which genes are turned on and how active these genes and then compare these genes activities in a cancer-free sample of the same part of the body, we can then predict if these genes contributed to the cancer or note.
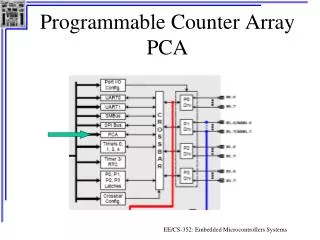
What is micro array? • A plate which contain collection of spots. Some plates have up to 24,000 spots on them • When plate is manufactured, in each spot a specific cDNA probe is fixed which attracts an mRNA for a specific gene. • Sample to be analyzed is poured into the plate. • mRNA from the sample swims and finds the correct spot to attach to.
One microarray generates one signal/vector in the space of genes
Data used in project • Bladder and Liver data. • Samples which contain micro array data from known normal and cancerous bladder and liver data. • Each sample is a vector of length n. (in this study, length was about 6,000 genes) • Each component of a vector is a value which represent how much a specific gene is expressed in the sample
Mathematics of PCA How to find the eigensignal (dominant signal)
How to use for cancer detection • 3 different algorithms used to determine if an arbitrary input sample is cancerous or not. • Each algorithm was compared for accuracy. • First algorithm uses • Second algorithm uses • Third algorithm is heuristic and uses a combination of
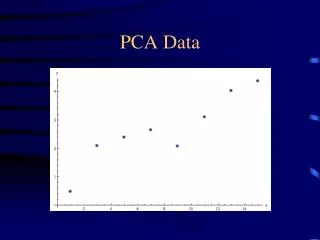
Using more than one eigensignal for finding correlation of arbitrary signal to population Only the first few eigensignals need be considered. Most of the information content is concentrated in the first (primary) eigensignals
K>> nSamples 104 [u,lam] = eig(theta); plot(flipud(diag(lam)))
Accuracy for the diagnosis algorithms for liver and bladder cancers
Graphical view of the projection of samples (signals) onto the eigensample (eigensignal) repeated over 100 random experiments105 known cancer samples and 76 known normal samples used.
The effect of changing the number of signals used to generate the eigensignal on the accuracy of PCA for cancer detection
The population used to generate the eigensignal from is called the working set.We now investigate the effect of changing the working set size on the accuracy of PCA for cancer detection
General final observations Based on the observations of the projections, we find that cancerous samples do not correlate positively as strongly with the cancerous dominant component when compared to how strongly the cancer-free samples negatively correlate with the cancerous dominant component. Cancerous samples correlate much strongly, but in the negative sense, with the cancer-free dominant component. Hence, when attempting to decide if a sample is cancerous or not, it is not recommend to measure the strength of the positive correlation with the cancerous dominant component, but instead one should measure the strength of how negatively the sample correlates with the cancer-free dominant component. The situation with cancer-free samples is different. Cancer-free samples do correlate very strongly in the positive sense with the cancer-free dominant principle component.
Cancer-free samples also correlate very strongly in the negative direction with the cancerous dominant component. From the above, we conclude that it is best to always correlate the sample to be examined with the cancer-free dominant component since a cancer-free sample will exhibit a strong positive correlation while at the same time a cancerous sample would exhibit a strong correlation but in the negative sense. In other words, both types of samples have stronger correlations with the cancer-free dominant component when looking at the absolute magnitude of the correlation than the case would be if we had used a cancerous dominant component. The third algorithm introduces a heuristic algorithmic improvement in the detection of cancer. As a result of this improvement, we were able to improve cancer detection. However, since this improvement in detection is based on a heuristic improvement, more tests are needed against larger set of data.
Study conclusion • Examining the correlation of an arbitrary tissue sample with the PCA dominant component sample generated from the cancer-free samples produces more accurate results for both cancer and cancer-free detection • An algorithmic improvement that considers the correlation of a sample against both PCA modes was implemented and was shown to produce more accurate diagnostic results. • The effect of adding more eigensignals on the accuracy of PCA could not mathematically be analyzed at this time due to lack of time. Some tests showed that adding more eigensignals improved accuracy, while others showed it reduced accuracy. More analysis is needed on this to understand why this happens. • PCA accuracy improved only slightly by increasing the working set size greatly. This shows that PCA can be effective in extracting dominant features that represent large population from small sample of the population.
Future possible research • Use SVD for PCA and compare to see if there exist any accuracy improvement. • Apply ICA (independent component analysis) and compare accuracy of ICA to PCA. See next slide for software flow diagram. • Apply this analysis to larger set of microarray cancer data from NBCI and Stanford databases