Download
1 / 27
290 likes | 543 Vues
Sensitivity of PCA for Traffic Anomaly Detection. Evaluating the robustness of current best practices. Haakon Ringberg 1 , Augustin Soule 2 , Jennifer Rexford 1 , Christophe Diot 2 1 Princeton University, 2 Thomson Research. Outline. Background and motivation Traffic anomaly detection

E N D
Sensitivity of PCA forTraffic Anomaly Detection Evaluating the robustness of current best practices Haakon Ringberg1, Augustin Soule2, Jennifer Rexford1, Christophe Diot2 1Princeton University, 2Thomson Research
Outline • Background and motivation • Traffic anomaly detection • PCA and subspace approach • Problems with methodology • Conclusion & future directions
Network anomalies We want to be able to detect these anomalies!
Network anomaly detectors • Monitor health of network • Real-time reporting of anomalies
Principal Components Analysis (PCA) Benefits • Finds correlations across multiple links • Network-wide analysis • [Lakhina SIGCOMM’04] • Demonstrated ability to detect wide variety of anomalies • [Lakhina IMC’04] • Subspace methodology • We use same software
Principal Components Analysis (PCA) • PCA transforms data into new coordinate system • Principal components (new bases) ordered by captured variance • The first k tend to capture periodic trends • normal subspace • vs. anomalous subspace
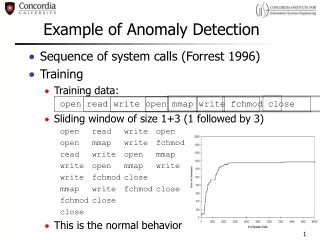
Pictorial overview ofsubspace methodology Training: separate normal & anomalous traffic patterns Detection: find spikes Identification: find original spatial location that caused spike (e.g. router, flow)
Pictorial overview of problems with subspace methodology • Defining normalcy can be challenging • Tunable knobs • Contamination • PCA’s coordinate remapping makes it difficult to identify the original location of an anomaly
Data used • Géant and Abilene networks • IP flow traces • 21/11 through 28/11 2005 • Anomalies were manually verified
Outline • Background and motivation • Problems with approach • Sensitivity to its parameters • Contamination of normalcy • Identifying the location of detected anomalies • Conclusion & future directions
Sensitivity to topk PCA separates normal from anomalous traffic patterns Works because top PCs tend to capture periodic trends And large fraction of variance
Sensitivity to topk • Where is the line drawn between normal and anomalous? • What is too anomalous?
Sensitivity to topk Very sensitive to number of principal components included!
Sensitivity to topk • Sensitivity wouldn’t be an issue if we could tune topk parameter • We’ve tried many different methods • 3σ deviation heuristic • Cattell’s Scree Test • Humphrey-Ilgen • Kaiser’s Criterion • None are reliable
Contamination of normalcy • What happens to large anomalies? • They capture a large fraction of variance • Therefore they are included among top PCs • Invalidates assumption that top PCs need to be periodic • Pollutes definition of normal • In our study, the outage to the left affected 75/77 links • Only detected on a handful!
Identifying anomaly locations • Spikes when state vector projected on anomaly subspace • But network operators don’t care about this • They want to know where it happened! • How do we find the original location of the anomaly?
Identifying anomaly locations • Previous work used a simple heuristic • Associate detected spike with k flows with the largest contribution to the state vector v • No clear a priori reason for this association
Outline • Background and motivation • Problems with approach • Conclusion & future directions • Defining normalcy • Identifying the location of an anomaly
Defining normalcy • Large anomalies can cause a spike in first few PCs • Diminishes effectiveness • But we can presumably smooth these out (WMA) • But first PCs aren’t always periodic • whichk instead of topk? • Initial results suggest this might be challenging also
Fundamental disconnect between objective functions • PCA is optimal at finding orthogonal vectors ordered by captured variance • But variance need not correspond to normalcy (i.e. periodicity) • When do they coincide?
Identifying anomaly locations • PCA is very effective at finding correlations • But is accomplished by remapping all data to new coordinate system • Strength in detection becomes weakness in identification • Inherent limitation
Conclusion • PCA is sensitive to its parameters • More robust methodology required • Training: defining normalcy (topk, whichk) • Detection: tuning threshold • Identification: better heuristic • Disconnect between objective functions • PCA finds variance • We seek periodicity • PCA’s strengths can be weaknesses • Transformation good at detecting correlations • Causes difficulty in identifying anomaly location
Thanks!Questions? Haakon Ringberg Princeton University Computer Science http://www.cs.princeton.edu/~hlarsen/
Outline • Background and motivation • Problems with approach • Future directions • Conclusion • Addressable problems, versus • Fundamental problems
Conclusion: addressable • PCA is sensitive to its parameters • More robust methodology required • Training: defining normalcy (topk, whichk) • Detection: tuning threshold • Identification: better heuristic • Previous work used same data and optimized parameter settings as Lakhina et al. • But these concerns might be addressable
Conclusion: fundamental • We don’t know what “normal” is • Disconnect between objective functions • PCA finds variance • We seek periodicity • PCA’s strengths can be weaknesses • Transformation good at detecting correlations • Causes difficulty in identifying anomaly location • Are other methods are more appropriate? • We require a standardized evaluation framework