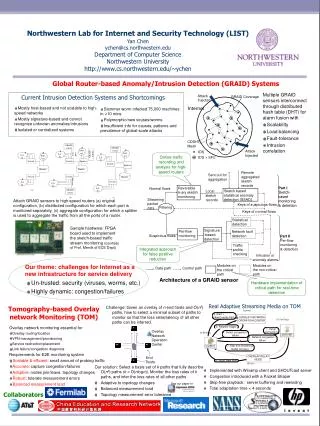
Anomaly Detection Systems
Anomaly Detection Systems. Contents. Statistical methods parametric non-parametric (clustering) Systems with learning. Anomaly detection. Establishes profiles of normal user/network behaviour Compares actual behaviour to those profiles


Anomaly Detection Systems
E N D
Presentation Transcript
Contents • Statistical methods • parametric • non-parametric (clustering) • Systems with learning
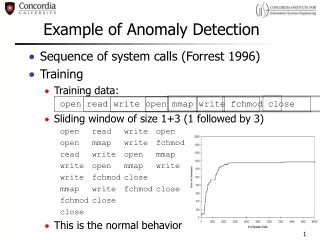
Anomaly detection • Establishes profiles of normal user/network behaviour • Compares actual behaviour to those profiles • Alerts if deviations from the normal are detected.
Anomaly detection • Profiles are defined as sets of metrics -measures of particular aspects of user/network behaviour. • Each metric is associated a threshold or permitted range of values.
Anomaly detection • Anomaly detection depends on an assumption that users/networks exhibit predictable, consistent patterns of system usage. • Adaptations to changes in behaviour over time are possible. • The problem with anomaly detection • No set of metrics is rich enough to express all anomalous behaviour.
Statistical methods • Statistical methods of anomaly detection are categorized as • Parametric methods • Assumptions are made about the underlying distribution of the data being analyzed. • Non-parametric methods • Involve nonparametric data classification techniques - cluster analysis.
Parametric methods • The usual assumption is that the distributions of usage patterns are Gaussian: x0 – mean - standard deviation
Parametric methods • The Denning’s model (the IDES model for intrusion). • Four statistical models may be included in the system: • Operational model • Mean and standard deviation model • Multivariate model • Markov process model. • Each model is suitable for a particular type of system metric.
Parametric methods • Operational model • This model applies to metrics such as event counters for the number of password failures in a particular time interval. • The model compares the metric to a set threshold, triggering an anomaly when the metric exceeds the threshold value.
Parametric methods • Mean and standard deviation model (1) • A classical mean and standard deviation characterization of data. • The assumption is that all the analyzer knows about system behaviour metrics are the mean and standard deviations.
Parametric methods • Mean and standard deviation model (2) • A new behaviour observation is defined to be abnormal if it falls outside a confidence interval. • This confidence interval is defined as ±dstandard deviations from the mean for some parameter d (usually d =3).
Parametric methods • Mean and standard deviation model (3) • This characterization is applicable to event counters, interval timers, and resource measures (memory, CPU, etc.) • It is possible to assign weights to these computations, such that, for example, more recent data are assigned greater weights.
Parametric methods • Multivariate model (1) • This is an extension to the mean and standard deviation model. • It is based on performing correlations among two or more metrics. • Instead of basing the detection of an anomaly strictly on one measure, one might base it on the correlation of that measure with another measure.
Parametric methods • Multivariate model (2) • Example: • Instead of detecting an anomaly based solely on the observed length of a session, one might base it on the correlation of the length of the session with the number of CPU cycles utilized.
Parametric methods • Markov process model (1) • Under this model, the system considers each different type of audit event as a state variable and uses a state transition matrix to characterize the transition frequencies between states (not the frequencies of the individual states/audit records).
Parametric methods • Markov process model (2) • A new observation is defined as anomalous if its probability, as determined by the previous state and value in the state transition matrix, is too low/high. • This allows the system to detect unusual command or event sequences, not just single events. • This introduces the concept of performing stateful analysis of event sequences (frequent episodes, etc.)
Parametric methods • Example - NIDES (Next-generation Intrusion Detection Expert System) (1) • Developed by SRI (Stanford Research Institute) in the 1990s. • Measures various activity levels. • Combines these into a single “normality” measure and checks it against a threshold. • If the measure is above the threshold, the activity is considered abnormal.
Parametric methods • Example - NIDES (2) • NIDES measures (1) • Intensity measures • An example would be the number of audit records (log entries) generated within a set time interval. • Several different time intervals are used in order to track short-, medium-, and long-term behaviour.
Parametric methods • Example - NIDES (3) • NIDES measures (2) • Distribution measures • The overall distribution of the various audit records (log file entries) is tracked via histograms. • A difference measure is defined to determine how close a given short-term histogram is to “normal” behaviour.
Parametric methods • Example - NIDES (4) • NIDES measures (3) • Categorical data • The names of files accessed or the names of remote computers accessed are examples of categorical data used.
Parametric methods • Example - NIDES (5) • NIDES measures (4) • Counting measures • These are numerical values that measure parameters such as the number of seconds of CPU time used. • They are generally taken over a fixed amount of time or over a specific event, such as a single login. • Thus, they are similar in character to intensity measures, although they measure a different kind of activity.
Parametric methods • Example - NIDES (6) • The different measurements each define a statistic Sj. • These measurements are assumed (designed to be) appropriate (this includes normalization), and are combined to produce a 2-like statistic:
Parametric methods • Example - NIDES (7) • A more complicated measure would include the correlation between the events (as was done with IDES): • Here, C is the correlation matrix between Si and Sj for all i and j. ISis called the IDES score.
Parametric methods • Example - NIDES (8) • NIDES compares recent activity with past activity, using a methodology that amounts to a sliding window on the past. • Thus it is designed to detect changes in activity and to adapt to new activity levels.
Parametric methods • Example - NIDES (9) • NIDES intensity measures are counts of audit records per time unit etc. • This provides an overall activity level for the system. • These are updated continuously rather than recomputed at each time interval.
Parametric methods • Example - NIDES (10) • Possible elements that can be monitored: • Average system load. • Number of active processes. • Number of E-mails received. • Different types of audit records (can be tracked separately).
Parametric methods • Example - NIDES (11) • The obvious extension of the intensity measures idea is to track the different types of audit records. • This leads to a distribution (histogram) for the audit records.
Parametric methods • Example - NIDES (12) • Similarly, one could track the sizes of E-mail messages received, or the types of files accessed. • These can be updated continuously. • Distributions are then compared by means of a squared error metric.
Parametric methods • Example - NIDES (13) • Categorical measures can be for example the names of files accessed. • They are treated just like distributional measures. • Now each bin corresponds to a categorical, while with distributional measures the bin can correspond to a range of values. • The updates are still performed continuously.
Parametric methods • Example - NIDES (14) • All the measures are combined in the T 2 statistic. • The value is compared with a threshold to determine if the activity is “abnormal”. • The threshold is usually set empirically, based on the observed network behaviour in some period of time.
Parametric methods • Example - NIDES (15) • NIDES produces a single, overall measure of “normality”, which could allow further investigation into the components that make up the statistic upon an alert. • The problem with this is that an unusually low value for one statistic can mask a high one for another – multifaceted measures are more useful.
Parametric methods • Advantages of parametric approach (1) • Statistical anomaly detection using parametric approach could reveal interesting, sometimes suspicious, activities that could lead to discoveries of security breaches. • Parametric statistical systems do not require the constant updates and maintenance that misuse detection systems do.
Parametric methods • Advantages of parametric approach (2) • However, metrics must be well chosen, adequate for good discrimination, and well-adapted to changes in behaviour (that is, changes in behaviour must produce a consistent, noticeable change in the corresponding metrics).
Parametric methods • Disadvantages of parametric approach (1) • Batch mode processing of audit records, which eliminates the capability to perform automated responses to block damage. • The memory and processing loads involved in using and maintaining the user/network profile knowledge base usually cause the system to lag behind audit record generation.
Parametric methods • Disadvantages of parametric approach (2) • The nature of statistical analysis reduces the capability of taking into account the sequential relationships between events. • The exact order of the occurrence of events is not provided as an attribute in most of these systems.
Parametric methods • Disadvantages of parametric approach (3) • Since many anomalies indicating attack depend on such sequential event relationships, this situation represents a serious limitation to the approach. • In cases when quantitative methods (Denning's operational model) are utilized, it is also difficult to select appropriate values for thresholds and ranges.
Parametric methods • Disadvantages of parametric approach (4) • The false positive rates associated with statistical analysis systems are high, which sometimes leads to users ignoring or disabling the systems. • The false negative rates are also difficult to reduce in these systems.
Non-parametric methods • One of the problems of parametric methods is that error rates are high when the assumptions about the distribution are incorrect. • When researchers began collecting information about system usage patterns that included attributes such as system resource usage, the distributions were discovered not to be Gaussian.
Non-parametric methods • Then, including Gaussian distribution assumption into the measures led to high error rates. • A way of overcoming these problems is to utilize non-parametric techniques for performing anomaly detection.
Non-parametric methods • Non-parametric approach • provides the capability of analyzing users with less predictable usage patterns • allows the system to take into account system measures that are not easily analyzed by parametric schemes.
Non-parametric methods • The non-parametric approach involves non-parametric data classification techniques, specifically cluster analysis. • In cluster analysis, large quantities of historical data are collected (a sample set) and organized into clusters according to some evaluation criteria.
Non-parametric methods • Pre-processing is performed in which features associated with a particular event stream (often mapped to a specific user) are converted into a vector representation (for example, Xi = [f1, f2, ..., fn ] in an n-dimensional state).
Non-parametric methods • A clustering algorithm is used to group vectors into classes by behaviours • members of each class are as close as possible to each other • different classes are as far apart as possible.
Non-parametric methods • In non-parametric statistical anomaly detection, the premise is that activity data, as expressed in terms of the features, fall into two distinct clusters: • a cluster indicating anomalous activity • a cluster indicating normal activity.
Non-parametric methods • Clustering algorithms • algorithms that use simple distance measures to determine whether an object falls into a cluster • concept-based algorithms (more complex) • an object is "scored“ according to a set of conditions and that score is used to determine membership in a particular cluster.
Non-parametric methods • The advantages of non-parametric approaches include the capability of performing reliable reduction of event data (in the transformation of raw event data to vectors). • This effect may reach as high as two orders of magnitude compared to the classical approach that does not include vectors.
Non-parametric methods • Other benefits are improvement in the speed of detection and improvement in accuracy over parametric statistical analysis. • Disadvantages involve concerns that expanding features beyond resource usage would reduce the efficiency and the accuracy of the analysis.
Clustering in anomaly detection • Formal definition: • Let P be a set of vectors, whose cardinality is m, and whose elements are p1,…,pm, of dimensions n1,…,nm, respectively. • The task: partition, optimizing a partition criterion, the set P into k subsets P1,…,Pk, such that the following holds:
Clustering in anomaly detection Incoming traffic/logs Data pre-processor Activity data Detection model(s) Detection algorithm Clustering! Alerts Action/Report Decision criteria Alert filter
Clustering in anomaly detection • Why should we do clustering instead of learning? • Labelling a large set of samples is often costly. • Very large data sets – train the system with a large amount of unlabelled data and then label with supervision, i.e. learning. • Track slow changes of patterns in time without supervision – improves performances. • Smart feature extraction. • Initial exploratory data analysis.