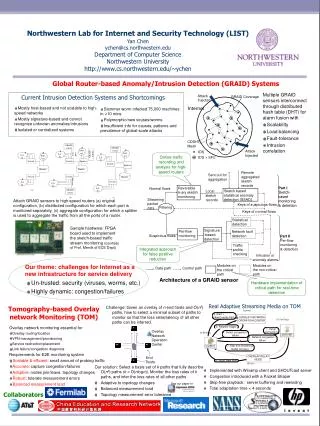
Data Regularity Impact on Anomaly Detection Accuracy
This research paper discusses how differences in data regularity can affect the accuracy of anomaly detection systems. It explores generating and injecting anomalies, training and testing methods, scoring mechanisms, and presentation of results using benchmark datasets. The paper presents findings on how the nature of background noise influences signal detection and how anomaly thresholds determine surprise levels. The study highlights the importance of understanding data structure variations for effective anomaly detection and emphasizes the need for customized systems based on data regularity. The conclusions underline the effectiveness of anomaly detection systems and the significance of adapting to changes in data regularity for improved detection accuracy.


Data Regularity Impact on Anomaly Detection Accuracy
E N D
Presentation Transcript
Benchmarking Anomaly-based Detection Systems Ashish Gupta Network Security May 2004
Overview • The Motivation for this paper • Waldo example • The approach • Structure in data • Generating the data and anomalies • Injecting anomalies • Results • Training and Testing: the method • Scoring • Presentation • The ROC curves: somewhat obvious
Motivation Does anomaly detection depend on regularity/randomness of data ?
The aim • Hypothesis: • Differences in data regularity affect anomaly detection • Different environments different regularity • Regularity • Highly redundant or random ? • Example of environment’s affect 010101010101010101010101 Or 0100011000101000100100101
Consequences One IDS : Different False Alarm Rates Need custom system/training for each environment ? Temporal affects: Regularity may vary over time ?
Structure in data Measuring randomness
010101010101010101010101 Or 0100011000101000100100101 Measuring Randomness + Relative Entropy Sequential Dependence Conditional Relative Entropy
The benchmark datasets • Three types: • Training data ( the background data) • Anomalies • Testing data ( background + anomalies ) • Generating the sequences • 5 sets, each set 11 files ( for increasing regularity) • Each set different alphabet size • Alphabet size decides complexity
Anomaly Generation • What’s a surprise ? • Different from the expected probability • Types: • Juxta-positional : different arrangements of data • 001001001001001001111 • Temporal • Unexpected periodicities • Other types ?
Types in this paper • Foreign symbol • AAABABBBABABCBBABABBA • Foreign n-gram • AAABABAABAABAAABBBBA • Rare n-gram • AABBBABBBABBBABBBABBBABBAA
Injecting anomalies • Make sure not more than 0.24 %
The experiments The Hypothesis is true
The hypothesis: • Nature of “normal” background noise affects signal detection • The anomaly detector • To detect anomalous subsequences • Learning phase n-gram probability table • Unexpected event anomaly ! • Anomaly threshold decides level of surprise
Example of anomaly detection AAC ANOMALY !
Scoring • Event outcomes • Hits • Misses • False alarms • Threshold • Decides level of surprise • 0 completely unsurprising, 1 astonishing • Need to calibrate
Presentation of results • Presents two aspects: • % correct detections • % false detections • Detector operates through a range of sensitivities • Higher sensitivity ? • Need the right sensitivity
Interpretation • Nothing overlaps regularity affects detection !
What does this mean ? • Detection metrics are data dependent • Cannot say: • My XYZ product will flag down 75% percent anomalies with 10% false hit rate ! • Sir, are you sure ?
Real world data • Regularity index for system calls for different users
Is this surprising ? • What about network traffic ?
Conclusions Anomaly Detection Effectiveness Data Structure Evaluation is data dependent
Conclusions Different system Or Change the parameters Change in regularity
Quirks ? • Assumes rather naïve detection systems • “Simple retraining will not suffice” • An intelligent detection can take this into account. • What is really an anomaly ? • If data is highly irregular, won’t randomness produce some anomalies by itself • Anomaly is a relative term • Here anomalies are generated independently