Visualizing Audio for Anomaly Detection Research
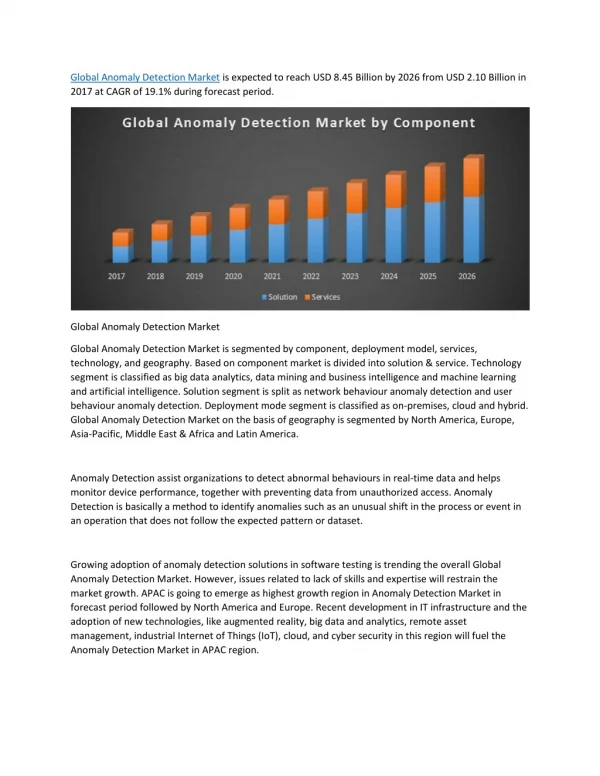
This research aims to enhance anomaly detection using audio visualization techniques, addressing challenges in interactive browsing and automated event detection. It proposes color-coding audio segments based on probabilistic features for improved analysis. Datasets include meeting room and airport audio, with unique data representations utilizing multiscale FFT and Bayesian feature selection. Two testbeds are explored: a portable multi-day audio timeliner for emergency responders and a vast dataset analysis with 1000 microphones. Findings indicate progress in meeting room audio transcription and ongoing advancements in data representations and testbed visualization.

Visualizing Audio for Anomaly Detection Research
E N D
Presentation Transcript
Visualizing Audio for Anomaly Detection • Mark Hasegawa-Johnson, Camille Goudeseune, Hank Kaczmarski, Thomas Huang, David Cohen, Xiaodan Zhuang, Xi Zhou, and Kyung-Tae Kim
Research Goals • Problem: Microphones are cheap, yet they are rarely used in security installations. • Interactive browsing is difficult: Audio is hard to browse much faster than real-time • Automatic acoustic event detection (AED) is nearly useless: many false alarms Proposal: Best of both worlds • Use probabilistic features (AED) to color-code audio segments, guiding analysts to pieces worth closer study
Dataset #1: Meeting Room Audio 30 annotators, 24 hours of data, 14 acoustic events
Dataset #2: Willard Airport • 24 hours of audio, `labeled' by commercial airplane takeoff & landing records (inadequate!)
Data Representations #1: Multiscale FFT • Problem: Short-time Fourier transforms with sizes N1, N2, N3, … require O{T(log2N1+log2N2+log2N3+...)}, T=audio filesize, N=FFT size • Solution: XN(2k) = XN/2,1(k)+XN/2,2(k)
Data Representations #2: Bayesian Feature Selection • Problem: Best features for nonspeech acoustic event detection are unknown (different from speech), different for different classes of acoustic events • Solution: Select the best features from a big pile, according to a minimum-Bayes-risk selection criterion
Testbed #1: Portable Multi-Day Audio Timeliner • Dramatis Personae: Emergency first responders (EFRs) • Analysis Object: One microphone, one month • Act 1, Scene 1: EFRs arrive on scene, download surveillance audio to a handheld • Objective: Event diagnosis, prognosis, & management
Testbed #2: 1000 Microphones = One Milliphone • Dramatis Personae: Command center data analysts • Analysis Object: 1000 microphones, 24 hours • Act 2, Scene 1: Analyst in a Virtual Reality Theater (the Beckman CUBE) seeks anomalies in a large dataset • Objective: Find the anomalies
Conclusions: Current Status of this Research, August 18 2009 • Results so far • Meeting room audio: transcription nearly complete. Airport audio: no transcriptions. • Data representations, Testbeds: separate prototypes exist • Ongoing research • Insert (Data Representations) into (Testbeds) • Create new data representations in order to improve testbed visualization • Formal human subject tests