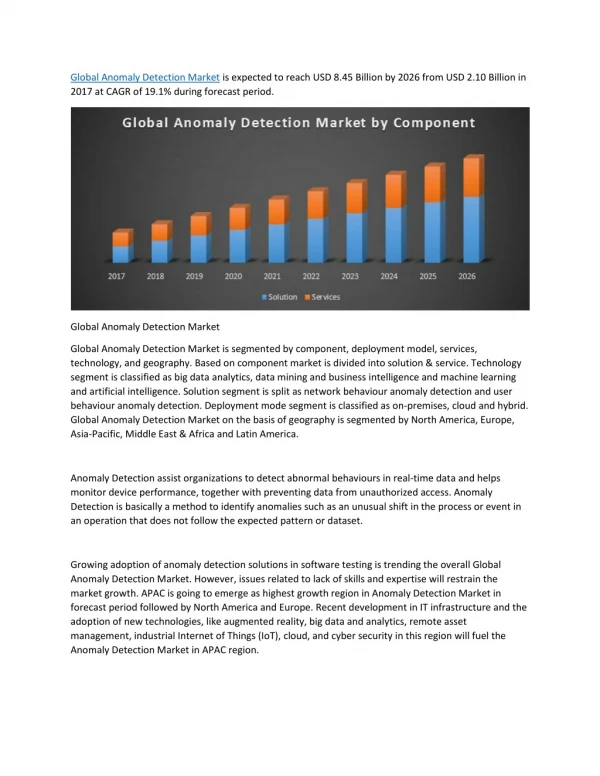
Download

1 / 30
510 likes | 1.08k Vues
Anomaly Detection - Traffic Video Surveillance. Ziming Zhang, Yucheng Zhao and Yiwen Wan. Outline. Introduction &Motivation Problem Statement Paper Summeries Discussion and Conclusions. What are Anomalies?.

E N D
Anomaly Detection -Traffic Video Surveillance Ziming Zhang, Yucheng Zhao and Yiwen Wan
Outline • Introduction&Motivation • Problem Statement • Paper Summeries • Discussion and Conclusions
What are Anomalies? • Anomaly is a pattern in the data that does not conform to the expected behaviour • Also referred to as outliers, exceptions, peculiarities, surprise, etc.
Anomaly Detection -Video Traffic Surveillance • Vehicle behavior is represented as trajectories • When trajectory does conform to dominant pattern it is detected as anomaly or outlier • Collective Anomalies outlier outlier
Problem Description & Definition Data Input: Spatio-temperal trajectories of moving objects
Problem Description & Definition • Scene Modeling: • Scene Representation: interest points/path • Learning Model:unsupervised/supervised
Problem Description & Definition Activity Analysis: virtual fencing, speed profiling, path classification, anomaly detection, online activity analysis and object interaction characterization
Key Challenges • Accurate and efficient representation of trajectories • Defining a representative normal pattern is challenging • The boundary between normal and outlying behaviour is often not precise • Availability of labelled data for training/validation • Data might contain noise • Normal behaviour keeps evolving
3 paper SummariesP1:Event Detection Using Trajectory Clustering and 4-D Histogram CláudioRosito Jung, Member, IEEE, LucianoHennemann, and SoraiaRauppMusse IEEE TRANSACTIONS ON CIRCUITS AND SYSTEMS FOR VIDEO TECHNOLOGY, VOL. 18, NO. 11, NOVEMBER 2008
Framework Input Trajectories Representation …… (x3,y3) Initial Clustering (x2,y2) (x1,y1) (xn,yn) Cluster Representation using 4-D histogram F=(x1-x2,y1-y2,x2-x3,y2-y3…xn-xn-1,yn-yn-1) Event Detection
Framework Input Trajectories Representation Initial Clustering Cluster Representation using 4-D histogram Event Detection
Framework Input Trajectories Representation Initial Clustering Cluster Representation using 4-D histogram Event Detection
Framework Input Trajectories Representation Initial Clustering Cluster Representation using 4-D histogram Event Detection
Summary • trajectories collected from trackers • Offline clustering based on Mixture of Gaussian is used for path modeling • 4-D histogram is used to represent spatial and temporal characteristics of each cluster/path for further event detection such as drift, shift, entry, bifurcation, confluence, incoherent local speed, incoherent local orientation pattern • Two dataset(pedestrian and traffic scenario) are tested and 20 human observers were used for accuracy validation: the number of evaluation that agreed with results from proposed method
3 paper SummariesP2: Clustering Vehicle Trajectories with Hidden Markov Models Application to Automated Traffic Safety Analysis Nicolas Saunier and TarekSayed
Introduction • Reduction of public resources on detecting traffic collision. • Conflicting causes collisions • Conflicting definition • Two or more vehicles closed enough in time and space • Trajectory representation • A sequence of {x, y, vx, vy}
Model • HMM (Hidden Markov Model)
Model • HMM (Hidden Markov Model) • Sequence of observation = {walk, shop, clean} • Compute the probability of observing a sequence, given a model. • Find the state sequence that maximizes the probability of the given sequence, when the model is known. (Viterbi) • Induce the HMM that maximizes the probability of the given sequence. (Baum-Welch)
Model • K-Means clustering
Model • HMM-based K-means clustering • A set of vehicle trajectories (sequences) • A set of initial HMM (k HMMs) • Step1: Calculating all the probabilities • Step2: Associating the trajectory with HMM that maximizes probability of the trajectory • Step3: Updating HMMs based on the temporary clustering result • Step4: Repeating step 1, 2 and 3 until convergence has been reached
Model • Training and testing the model • Several instances of conflicting trajectory pairs train the model to identify mutual conflicting trajectory clusters • New trajectories are associated with certain trajectory cluster based on the specific HMM probability maximization • Conflicting trajectories are identified by their clustering result.
3 paper SummariesP3: On-line trajectory clustering for anomalous events detection C. Piciarelli *, G.L. Foresti Department of Mathematics and Computer Science, University of Udine, Via delleScienze 206, 33100 Udine, Italy Available online 21 April 2006
Introduction • Problem: Classical two-step clustering algorithm can not update cluster dynamically • Solution: On-line trajectory clustering approach with a tree-like structure • Goal:Suit for video surveillances sysytems from image analysis to behavior analysis to detect anomalous events
Problem Definition Traditional trajectory clustering not suited for detect anomalous events • off-line: not useful in activity analysis • video system: complex structure,from moving ojects(low level) to behaviour analysis (high)
Proposed Algorithm Representing trajectories as a tree of cluster • Trajectory(Ti): represented by a list of vectors Tij(representing a spatial position at time j) • Clusters(Ci): organized in a tree-like structure that, augmented with probability information, represented as a list of vectors • Define a distance or similarit to check if a Ti matches a given Ci( dynamically), when a Ti matches a Ci, cluster needs to be updated.
Tree-like Structure Tree creation steps: 1)building,create tree of clusters from acquried data dynamically,without waitting the end of trajectory. 2)maintenance as below:
Summary For behaviour analysis, we define that an anomaly is an event happening rarely. Also we assume that dangerous events are generally anomalous. An anomalous trjectory can be defined as a trajectory matches a path in the tree with low probability. With probabilitic information, we can implement anomaly detection.
Conclusion • Availability of labelled data for training/validation is not easy and unsupervised clustering is favored • online clustering is very important since normal behaviour keeps evolving • Approaches robust to noisy trajectories from tracking is preferred
Thanks!!! • Questions?