Download

1 / 72
720 likes | 906 Vues
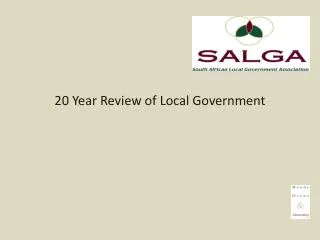
20 Year Review of Local Government. SALGA Management Committee – 12 May 2013 Presenter: Wendy Ovens. Overview of the Presentation. Project brief Research methodology Phasing the establishment of local government Establishing the policy and legal framework Demarcating boundaries

E N D
20 Year Review of Local Government SALGA Management Committee – 12 May 2013 Presenter: Wendy Ovens
Overview of the Presentation • Project brief • Research methodology • Phasing the establishment of local government • Establishing the policy and legal framework • Demarcating boundaries • Bedding down powers and functions • What about service delivery? • Fiscal framework and financial management • Institutionalising democracy • Local Government Support programmes • Overall comments
Project brief and research methodology • The Presidency is driving the 20 Year Review regarding the country’s performance post 1994 • Three focus project areas: • The local government journey post 1994 • What have been the significant achievements within the local government sector • What aspects need improvement to promote the stability, efficiency and effectiveness of local government in South Africa • Todays presentation focusses on the “story line” • The 20 year was largely prepared on secondary sources such as policy papers, legislation, reports and articles
Phasing the establishment of local government Pre 1994: • Racialisation of local government peaked in mid 1980s • RSCS and JSBs established to assist failing BLAs • 1980s – violent protests, extensive rent and consumer boycotts • Formation of slogan “one city one tax base” • Establishment of local government negotiation forums – white local authorities negotiated with local civic organisation • The local government negotiations one of the key sticking points in the Multi Party Negotiating Forum • Local Government Negotiating Forum established – led to enactment of the Local Government Transition Act • Local government to be established in three phases: • Pre interim phase • Interim phase • Final phase
Phasing the establishment of local government The Pre-Interim Phase 1993-1995 • Negotiating forums become statutory structures • Commonly referred to as “local governments of unity” • Tasked with inter alia: • Determining budgets • Selecting executive committees by two third majority • Important holding structures – important mechanism of creating stability • Local government elections took place 1995 and in 1996 in KZN
Phasing the establishment of local government The interim phase 1995 – 2000 • A total of 843 transitional councils were established • Again skewed racial representation • 50% of the wards had to be located in the area of the former white local authority • Wards 60% of representation • Proportional representation – 40% • Guaranteed 30% representation from former white Local Authorities • Metros had two tier system – metro and substructures • Transitional Local Councils – single tier • Complex system of rural councils – single tier – either a district mechanism or a local one • Importantly during this period – Final constitution adopted, LG policy formulated, key LG legislation drafted
Phasing the establishment of local government Final phase – Democratic local government • Establishment of 3 categories: • Category A: Metropolitan • Category B: Local • Category C: District • Established in 2000 – first term of fully democratic non-racial local government post 1994 • Introduced two tier system for local government outside of metros • Introduced a single tier for metros • The real work of establishing effective and efficient local government • The system of local government as we now know it is only 13 years old – internationally, this would be considered a very short time frame
Establishing the policy and legal framework Constitution • Main provisions Chapter 7 of the Constitution • Bill of rights – Chapter 2 • Cooperative governance – Chapter 3 • Fiscal powers - Chapter 13 • Key provisions or shifts: • “Right to govern, on its own initiative, the local government affairs of its community” • Set framework for developmental local government • Set out the categories for local government • Powers and functions • Establishment of an independent Demarcation Board • Establishment and membership of Councils • Establishment of organised local government
Establishing the policy and legal framework White Paper on Local Government • The White Paper adequately described the challenges at local level • Set out the requirements for developmental local government • Addressed institutional political and administrative systems – metros and districts • A strong role for district municipalities • Policy framed an approach which was to be consistently applied across the country – the “ideal” or “prototype” system of local government
Establishing the policy and legal framework White Paper on Local Government • Four years post democracy – difficult to propose a highly differentiated model • Policy informed the drafting of the legislation – especially that prepared in parallel with the White Paper • But shifts in policy and the manner in implementation took place has undermined the system proposed especially in relation to the district municipalities • Still remains an important policy if only to allow for an understanding of the legislators intent • Fundamental concepts such as developmental local government and its related components remain in place
Establishing the policy and legal framework Basket of local government legislation Fiscal Powers and Functions Act 2008 Property Rates Act 2004 MFMA 2003 Systems Act 2000 • Complete redraft of local government legislation • Comprehensive framework rapidly prepared • Guide by Constitution and White Paper Demarcation and Structures Acts 1998 Organised LG Act 1997 Constitution 1996
Establishing the policy and legal framework • Given the speed at which the drafting took place and the enormity of establishing a democratic nonracial local government, amendments were inevitable • Varying types of amendments: • Ensuring Constitutional compliance • Resolving aspects for which there was insufficient legal certainty and or addressing omissions • Facilitating the implementation of the legislation and or the system of local government • Resolving operational matters • Addressing political imperatives • Strengthening aspects relating to accountability and or ensuring effective management • Creating greater efficiencies • Real willingness to amend legislation – certainly in the earlier periods
Demarcating boundaries Transitional Councils • Provincial Demarcation Boards – 50% Statutory and 50% Non Statutory • Proposed boundaries to MEC • MECs were empowered to amend and finalise boundaries • 843 municipalities established • Nearest neighbour principle was largely applied and or areas which formed part of the Local Government Negotiating Forums • Local structures were not fully democratic – hence necessary for the MECs to have boundary oversight
Demarcating boundaries • Independent Board established for the determination of boundaries • Required to establish wall to wall municipalities – categories A,B and C • Same system to be applied for the establishment of district and locals regardless of the following: • Socio economic conditions • Previous local government history • Capacity • Infrastructure • Ability to generate revenue • Very different system – no local government building blocks rather the objectives and criteria in the Act – outer boundaries built from the enumerator areas
Demarcating boundaries • Section 2 of the Municipal Structures Act sets out the requirements for metros • The determination of the district and local municipalities largely driven by requirements of the Constitution and the Boards own policy • Cross boundary municipalities established to address unresolved provincial boundary disputes
Demarcating boundaries Towards the 2006 local government boundary set • Key issue – underperformance of the cross boundary areas • Required amendments to the provincial boundary • This is NOT an MDB competency – rather requires an amendment to the Constitution – driven by COGTA • In addition to the amendments to accommodate the disestablishment cross boundary municipalities– also amended the provincial boundary between KZN and the Eastern Cape • In light of provincial boundary changes – District boundaries amended to include local municipalities • Significant resistance to Merafong inclusion into the North West and the boundary amendments in Eastern Cape and KZN • Board was heavily criticised for the boundary amendments linked to the provincial boundary changes – start of the slow discrediting of the MDB
Demarcating boundaries Towards the 2011 local government boundary set • 3 key decisions • Determination of two additional metros • Removal of the district management areas • District municipalities should have 3 or more local municipalities to allow for greater efficiencies • Originally, Buffalo City, Mangaung and Msunduzi were proposed – latter withdrawn as KZN request the entire district form part of the metro • Alfred Nzo DM expanded to 4 local municipalities and Metsweding disestablished and absorbed into Tshwane metro
Demarcating boundaries • The demarcation of the outer boundaries took place within a 12 month period • This did not allow for careful consideration of each and every boundary • Over the last 12 years, the process of refining municipal boundaries has been undertaken • The 1999 boundary demarcation elicited 4 legal challenges, some of which were dropped there were no protests linked to the boundaries • The uprising post the 2006 demarcations were an early indication of the community perceptions with respect to the importance of outer boundaries • The recent protests re the proposed amalgamation of Metsimholo and Ngwathe Local Municipalities is an indication of the challenges that may be faced with any future major re-demarcations
Demarcating boundaries • Local politics and community perceptions are intertwined with growing concern about the independence of the Demarcation Board • Boundaries are now increasingly becoming closely guarded by communities and political interests • Anecdotally, it would appear that it takes approximately 2 years for a municipal area to settle post a major re-demarcation • Such disruptions negatively impact service delivery creating local uncertainty and discontent • A number of significant demarcation questions remain which includes addressing the so called non-viable municipalities and establishing further single tier (category A) municipalities
Bedding down powers and functions Interim phase • Board powers and functions outlined in the interim Constitution “local government shall, to the extent determined in any applicable law, make provision for access by all persons residing within its area of jurisdiction to water, sanitation, transportation facilities, electricity, primary health services, education, housing and security within a safe and healthy environment, provided that such services and amenities can be rendered in a sustainable manner and are financially and physically practicable • Details left to MECs to publish • Local Government Transition Act – outlined P&Fs for Metros and substructures • Contained a number of functions previously performed by white local authorities – such as libraries and ambulances
Bedding down powers and functions • Local government powers and functions outlined in Schedule 4 Part B and Schedule 5 Part B of the Constitution • Metro has all of these functions • Section 84 of the Municipal Structures Act provides for the division of powers and functions for local and district municipalities • District municipalities functions in the Structures Act reflect the intentions of the DC role as outlined in the White Paper • Possible assignment of functions from national and provincial govenment
Bedding down powers and functions Implementing the division of powers and functions • Instead of “taking the plunge” and allowing the system to come into effect • An amendment to the Structures Act was made to allow the newly established municipalities in 2000 to continue performing the “status quo” • The main reason was to ensure that municipalities were able to stabilise their structures and systems prior to any major reorganisation of powers and functions • Key shift in policy: • Adjustment of the water and sanitation to 25 district municipalities • Change in the definition of Municipal Health Services – to environmental health only • Electricity – status quo to be retained
Bedding down powers and functions • MECs functions • Largely based on the MDBs capacity assessment undertaken in 2002/03 • Some provinces opted to make very few adjustments – WC • Some implemented own policy – for example – the district to perform the entire fire fighting function – Limpopo • MDB annual capacity assessment done until 2008/09 with recommendations to MECs – ongoing adjustments • Attempt to move closer to powers and functions as outline in Section 84 • MDB prepared a report outlining the norms and standards for municipal functions to assist with the capacity assessment process
Bedding down powers and functions District adjustments – Feb 2009 LM Adjustments – Feb 2009 (Most common)
Bedding down powers and functions Division of Powers and Functions – reflections • Implementation has allowed for a number of distortions or problems to creep into the system. • Instead of allowing the district and local municipalities to perform their functions as envisaged in the Municipal Structures Act immediately post the 2000 elections, the status quo was retained • This meant that a number of municipalities, which were not performing the function in 2000, failed to develop capacity • The MECs adjustments were then made on the capacity assessment which was based on the “status quo”. • Consequently the proposed system for district municipalities was not truly tested in some areas.
Bedding down powers and functions Division of Powers and Functions – reflections continued • Errors made in the publication of adjustments due to a lack of capacity at Provincial level • Lack of understanding of the adjustment process resulted in the bouncing of functions from one tier to another in a manner which undermined service delivery. • There was no framework for guiding the frequency of adjustments – consequently done annually by some provinces without considering the implications • Adjustments made but with no capacity in place – for example firefighting in the Limpopo province • While overtime – municipalities demonstrated an improvement in the overall number of functions performed with some capacity in some provinces as decline was found
Bedding down powers and functions Municipalities performing provincial or national functions • A number of functions were historically performed by especially large white local authorities with the practices continuing into the interim phase such as ambulances, libraries, museums and environmental conservation. • Health services included the provision of primary health care services • Post 2000, many provinces have struggled to “provincialise” many of these functions. • Some provincial functions are performed by municipalities • On an agency basis or delegated responsibility • The practice remains but without a coherent agreement in place. • Are some instances where municipalities are required to cross subsidise the functions being performed at the local level • Assignments by way of legislation have in a number of instances been ad hoc, without adequate consultation, placing a burden on local governments without the necessary supporting resources.
Bedding down powers and functions Challenges with the current powers and functions framework • There are a number of functions that span all three spheres of government eg. • Roads • Health services • Planning and land use management and • Transport • The overlaps tend to lead to duplication in service provision and a lack of clarity in relation to who is responsible for what aspect of the function and where • No coherent set of legislated function definitions • A number of functions allocated to provincial and national government which would be better located at the local level for example the housing function – hampered effective planning but also project implementation • As municipalities continue to perform provincial functions, provincial and national government have also assumed the responsibility for some of the local government functions • The on-going adjustments have also resulted in considerable local uncertainty
Bedding down powers and functions Rethinking Powers and Functions • There is the need to urgently develop a rational division of powers and functions for supporting and promoting developmental local government. • A framework needs to be adopted at national level for ensuring the appropriate alignment of functions in support of the overall mandates of provinces, districts, local and metropolitan municipalities. • The principal of subsidiarity must be applied in the assignment of functions. • Attention must be given to the specific requirements for promoting urban and rural development. This requires a rational but differentiated approach to the allocation of functions • Those functions which were historically performed at the local level, are yet to be provincialized should remain at the local level such as libraries, local museums and the licensing of vehicles
What about service delivery? Introducing Integrated Development Planning • 5 year plan – we are now into the 3rd cycle • First IDPs in 2000 – DPLG prepared manual and established support centres • IDPs are an important tool for guiding and justifying infrastructure development • Means of assessing municipal performance • All municipalities now comply with the legislative requirements for preparing IDPs • Quality still remains a challenge – products are mechanistic and process driven planning approaches
What about service delivery? Few IDPs reflect strategic considerations: • National and provincial development goals, priorities and challenges • A shared perspective of the district or metropolitan space economy • Strategic alternatives for addressing district or metro based developmental challenges • The management of difficult choices and trade-offs regarding infrastructure investment and development spending priorities • Agreements with national and provincial sectors and line departments with respect to infrastructure investment and development spending within their shared area of impact • Challenges with linking IDPs and SDFs
What about service delivery? • Selecting the appropriate service delivery mechanism • Internal • External but: • Some municipalities have completed section 78 investigations but many have not • Are challenges with the use of entities • Shared Services Model • Growing practice especially in the Western Cape and KZN • Used extensively for supporting the Operation Clean Audit
What about service delivery? Municipal Capacity Levels • The MDB Capacity Assessments overtime have demonstrated large variations in staffing levels for different types of municipalities. • The 2008/09 capacity confirmed that at local municipal level the B1 municipalities had significantly higher staffing levels when compared with B4 and B3 municipalities • B1 experienced a slight decrease in staffing levels from 2002/03 to 2008/09 • B3 had the largest increase and have improved their staffing levels by approximately 38%. • B4 experienced the highest improvement, (77%) in the staff to household ratio when compared to the other classifications of municipalities - the 2002/03 to the 2008/9 assessment periods. • B3 demonstrated a 58% improvement with the classification • The improvement in staff to household ratio indicates a strong positive trend especially in some of the poorest regions of South Africa
What about service delivery? Municipal Capacity Levels continued • The 2011 MDB capacity assessment results indicate that in the B4 municipalities - approximately 71% of the operating expenditure with 41% of the staff being allocated to governance and administration • Approximately 29% expenditure but with 59% of the staff are allocated to service delivery. • This is a significant variation when compared with B2 and B3 municipalities which have between 36-38% operating expenditure allocated to governance and administration • B1 municipalities and metros showing results of 17% and 18% operating expenditure for G&A respectively
What about service delivery? • When examining the census results for 2001 and 2011, it is apparent that significant progress has been made in relation to addressing the basic service backlogs. • Those functions for which other agencies are part of the delivery process, such as Eskom and water boards, greater progress appears to have been made • Refuse removal which has largely remained a service rendered by the municipality only, less progress has been found. • It should be noted that in some areas especially in the so called B3 and B4 municipalities, such services were only introduced within the last 10 years with the municipalities still needing to develop the necessary capacity.
What about service delivery? Service Delivery Protests (Powell 2012) Average protest per month: • 2007 – 8.73 • 2008 – 9.83 • 2009 – 19.18 • 2010 – 16.33 Increasingly prone to violence • 2007 – 42% • 2008 – 38% • 2009 – 44% • 2010 – 54% Other kinds of protest – 70 towns nationally have declared a dispute
DeVisser and Powell – Service Delivery Protest Barometer 2007 – 2012 (www.migi.org.za)
DeVisser and Powell – Service Delivery Protest Barometer 2007 – 2012 (www.migi.org.za)
Fiscal framework and financial management Implementing the Local Government Equitable Share • In 1998, a decision was taken by the then Department of Finance to determine the equitable share based on a formula to ensure that the allocations were • objective • transparent • scientific and • beyond manipulation by policy makers or municipalities • Two formulae operationalised • Basic service – (S) grant • Municipal Institutional - (I) grant • Number of changes occurred during this period – Formula reviewed in 2004 and implemented in the 2005/06 year • Again changes – and the formula is once again under review
Fiscal framework and financial management FFC 2012/13
Fiscal framework and financial management • LG in South Africa is largely self-financing – ability to minimise consumer debt is critical • Non-payment occurs from a number of sources including households, businesses, government and other more minor sources. • The FFC analysis of municipal consumer debt from 2004/05 to the 2009/10 financial periods demonstrates that the consumer debt levels are slowly decreasing. • However, two categories of municipalities namely the secondary cities and the “districts with major powers” are showing rising levels of debt • Metros have just under R4 Billion consumer debt • Remaining challenges include: • Inadequacy of the municipal billing systems • Poor metering • Lack of affordability • High tariffs