Download
1 / 18
180 likes | 282 Vues
Explore the assessment of groundwater chemical status in Denmark based on EU directives. Understand the challenges, associated aquatic ecosystems, and the impact of climate change on water management.

E N D
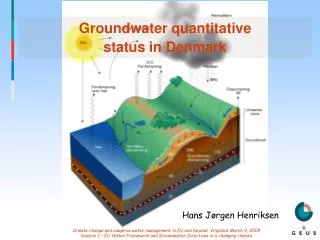
1/18 Groundwater chemical status in Denmark Klaus Hinsby, GEUS Climate change and adaptive water management in EU and beyond: Themeday at ATV winter meeting 9.3.2009 – including relaunch of Danish IAH national chapter.
2/18 WFD & GWD stipulate that: • EU MS have to achieve good groundwater status in 2015 based on environmental standards and good status objectives for: • 1) Legitimate uses (drinking water, etc.) • 2) Associated aquatic ecosystems • 3) Dependent terrestrial ecosystems
3/18 Good chemical status: • A body or a group of bodies of groundwater shall be considered to be of good chemical status when:….. ….. relevant threshold values established ….are not exceeded
4/18 Example of groundwater chemical status assessment based on good status objectives for associated aquatic ecosystems: Sea Floor Anoxia (Horsens Fjord Estuary, Denmark) Harmful Algal Blooms/ HABs (Cyanobacteria) Baltic Sea between Denmark and Germany – 25.8.2006 Foto: Klaus Hinsby, GEUS Photo: NERI – Univ. Aarhus / Peter Bondo Christensen
6/18 GW TV for nitrate based on good status objectives for associated aquatic ecosystems: Photo of Seafloor Anoxia Odense PRB Photo of Cyanobacteria Courtesy GRAS A/S University of Copenhagen / DHI Water and Environment
7/18 Global review of hypoxia in coastal marine waters Diaz and Rosenberg, 2008. Science, 321, 926-929
8/18 N fertilizer application and groundwater concentrations as a function of time 1950 - 2000 Natural background level in gw From Hinsby et al. Groundwater quality and age. In P. Quevauviller (ed.) Groundwater Science and Policy. RSC Publishing, London, 2008.
9/18 Threshold value for nitrate in oxic groundwater in the Odense Pilot River Basin Nielsen et al. 2003 => ~1/3 x N to Odense Fjord estuary to achieve good status <= Conceptuel model of Odense Pilot River Basin: After Dahl et al., J. Hydrol, 2007 & Hinsby et al. Sci Tot Env, 2008 ~1/3 x N to Odense river <= ~1/3 x N to oxic groundwater
10/18 Derivation of groundwater TV for N based on sustainable load to Odense river and Fjord: 3) Average of previous estimates (Windolf et al. 2003, Hansen, 2006 and Hinsby et al. 2008 (~ 18 mg/l NO3-, assuming 90 % of N is in nitrate
11/18 Nitrate in the unsaturated zone and groundwater at different depths – data from the LOOP and GRUMO monitoring programmes DWS = 50 mg/l TV = 18 mg/l for oxic groundwater Average nitrate concentrations in different depths. Data from LOOP (Grant, 2007) and GRUMO (Thorling, 2007) monitoring databases and reports.
12/18 Average nitrate concentrations in oxic groundwater and streams in Danmark, 1990 - 2004 Oxic groundwater Streams TV = 18 mg/l for oxic groundwater Data from (Thorling, 2007) and (Kronvang et al., 2008). Modified from Hinsby and Jørgensen, in press.
Nitrate concentrations in the Åkær stream catchment, december 2008 13/18 Red color indicate nitrate above DWS = 50 mg/l
Nitrate concentrations in the Åkær stream catchment, december 2008 14/18 Red color indicate nitrate above TV = 18 mg/l Highest value: 101 mg/l in drainage tile Lowest value: 0 mg/l in forest spring Åkær stream: 30 mg/l
15/18 Cumulative frequency plot of nitrate in Danish GRUMO wells 2006-2007 (n = 426) ~40 % > DWS of 50 mg/l ~70 % > TV of 18 mg/l i.e. ~70 % of oxic groundwater in Denmark has a poor quality when based on groundwater TVs for nitrate derived from good status objectives for aquatic ecosystems NO3 (mg/l)
Climate change, Eutrophication and sea floor anoxia/hypoxia 16/18 Climate models predict increasing winter precipitation, hence increasing river discharge and nutrient export(~ 8% in the A2 scenario according to Andersen et al., Sci. Tot Environ, 365, 2006) Relative change in river discharge at station 55.01 (Zealand) for the A2 and B2 emission scenarios compared to present. Modified from van Roosmalen et al., Vadose Zone Journal, 2007. As well as increasing Baltic Sea temperatures Simulated T in the Baltic Sea in the A2 and B1 scenarios, Shaffer et al. Nature Geoscience, 2009 and oxygen depletion (=> increased risk of algal blooms and Sea floor anoxia) Simulated dissolved O2 in the Baltic Sea in the A2 and B1 scenarios, Shaffer et al. Nature Geoscience, 2009 Foto: Klaus Hinsby
17/18 Conclusions and perspectives: • The major part of the shallow oxic Danish groundwater has a poor quality according to status assessments based on EU directives and guidelines • A major part of shallow oxic Danish groundwater will most probably not comply with good status objectives in 2015 • Climate change will most probably work against the effect of measures to reduce nutrient loads • There’s a strong need for developing new agricultural practices safe guarding water resources, human and environmental health
18/18 HAB (cyanobacteria) in the Baltic Sea between Denmark and Germany – 25.8.2006 Thank You ☺ Foto: Klaus Hinsby