Download
1 / 43
430 likes | 497 Vues
Explore the probabilistic framework for risk modeling and mapping hazards to assess vulnerabilities, damages, and financial implications for stakeholders. Case studies illustrate effective disaster risk profiles in India, Maldives, and Romania.

E N D
Mainstreaming Hazard Risk Assessment for Preparedness Inderjit Claire Vice President Sales, RMSI
Probabilistic Framework for Risk Modeling - Earthquake Generate Stoch. Events Calculate Damage Financial Loss Apply Exposure Assess EarthquakeMotion Where? How large? How often? How strong are the ground motions? How do they attenuate? How are they amplified? Where is the exposure? What is its value? What types of buildings? How are the buildings damaged? What are the financial implications to local/provincial federal govt. stakeholders, insurers and reinsurers?
Vulnerability • At what scale the vulnerability mapping needs to be done At what scale the vulnerability mapping needs to be done Vulnerability parameters
Vulnerability has a Spatial Component • Which places are more vulnerable to a hazard? • Targeting geographical region, socio-economic class • Who are the vulnerable people? • Relative vulnerability among households and individuals • What should be done? • Link to intervention/ adaptation
Social Vulnerability • Coping Ability • Resistance • Resilience • Social Environment • Age • Gender • Ethnicity • Household type • Economic Environment • Income and Assets • Insurance • Debts • Overlay environmental hazard maps with vulnerability maps to determine areas vulnerable to hazards • Add values, weights, factors for each variable in each layer to represent “Total Vulnerability”
Case Study 1 - The India Example • Perils – Earthquakes, Tsunami, Floods, etc. • For effective risk mitigation, it is critical to undertake risk assessment studies to know what, and how much is at risk • Risk reduction can be achieved through multiple risk transfer strategies
Earthquake Hazard Mapping 100 year Return period earthquake hazard map of Gujarat 100 year Return period earthquake hazard map of Maharashtra
Case Study 2: Developing a Disaster Risk Profile for Maldives • Business need • Maldives was among the most severely affected countries hit by the Asian Tsunami on December 26, 2004 • UNDP initiated a study to analyze Maldives’ high level of vulnerability and to avoid the present scale of losses and damage in the future • Recovery and development planning to be based on Disaster Risk Management (DRM) strategy
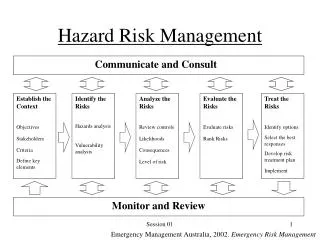
Hazard Assessment Historical data Tsunami Storm Earthquake SLR Hazard zones Vulnerability Analysis Exposure Physical Social Damages/Losses Affected Population Risk Profiling Weights Individual hazards and multi hazard Historical data Risk indices by island Physical Social Risk Profiling Individual hazards and multi hazard Case Study 2: Developing a Disaster Risk Profile for Maldives • Solution • Countrywide study: 200 inhabited islands out of a total of 1190 islands - completed in a challenging timeframe of 6 months • Hazards: Tsunami, Earthquake, Storms, Floods, and Climate Change • Vulnerability: Physical and Social • Exposures: Buildings, infrastructure and agriculture • GIS base map developed • GIS and CAT risk modeling integration • Hazard and risk maps developed • Assessments represented on a 5 point ordinal scale
Case Study 2: Developing a Disaster Risk Profile for Maldives • Benefits • Comprehensive report and base maps generated • Government of Maldives used the report as a key input for planning developmental strategies to mitigate future disasters • First GIS base map of Maldives developed • 3-D view of bathymetry of Maldives (depth in meters)
Case Study 3: Romania Earthquake Scenario • Earthquake estimation loss model to evaluate earthquake risks for better risk management • Data Model and Software Application for damage computation along the sub-crustal Vrancea zone • Compute direct and indirect potential damages following an earthquake
Benefits • The software enables the users and decision makers to: • Assess damages • Prioritize and plan relief and rehabilitation requirements • Prepare and train emergency workers • Prepare action plans regarding essential and strategic facilities • Import new earthquake scenarios data and visualize their impact
The Software A sample scenario
Authentication The user logs in with his designated credentials
Choice of Earthquake Scenario 13 precompiled events User selects the 475 yrs return earthquake
Buildings Residential Commercial Industrial Essential Services - hospitals, police stations etc. Public High Risk
Social Impact Casualties Death Injuries Subsistence (long & short term) Shelter Food Energy Water
Lifelines Roads & Bridges Railways & Bridges Airports Ports Water Supply Systems Sewerage Systems Power Grids Communication Systems Gas & Fuel Pipelines
High Risk Facilities Chemical Plants Nuclear Plants Dams Hydrotechnical Works
Secondary Hazard Fire Explosion
Region Selection Select single or multiple counties
Choice of Maps & Reports Map Output Report Output
Footprint Of An Earthquake Footprint of the ground motion of the earthquake in terms of Peak Ground Acceleration (PGA) This study covers 17 counties out of the 32 counties of Romania Additional data for the other counties can be added by the user in the future
Residential Buildings Collapsed In An Earthquake of Magnitude 7.4
Railway Routes Affected by an Earthquake Red – Blocked Yellow – Affected Green - Not affected
Intervention Priority For Commercial Buildings Priority of rescue and rehabilitation work
Areas Affected By Earthquake County view
Areas Affected By Earthquake Locality View
For Commercial Buildings EarthquakeScenario County name Locality name Type of construction Number of stories Total number of buildings Number of buildings affected Number of buildings collapsed
For Chemical Facilities Earthquake scenario considered County name Location name Chemical plant name Name of chemical Type of chemical Whether the facility is affected Probability of accident
Effective Management of Hazard Risks • Integrate Disaster Risk Management into the national, regional, and local economic development process • Undertake detailed risk and vulnerability assessment studies to gather accurate information for ex-ante pre hazard risk management • What is the country’s hazard exposure • What is the nature of hazards and their disruptive characteristics • Where is the risk concentrated • What can be the economic and social losses • Who are the people at risk – individuals and groups • What economic activities are vulnerable
The paradigm shift • Fate Choice • Reactive Proactive • Recovery Mitigation • Wait and watch Anticipate and prevent • Ex-post Ex-ante • Crisis management Risk management • Ad-hoc efforts Comprehensive approach • Development at risk Sustainable development Benefits of Risk and Vulnerability Assessments • With in-depth understanding of the potential economic losses, countries would be • Better placed to review the physical, human, and financial exposures • Determine the level of risk that can be accepted and the level of risk that should be mitigated
info@rmsi.com www.rmsi.com