Download
1 / 23
230 likes | 446 Vues
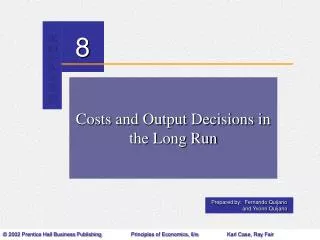
8. Short-run costs and output decisions. CHAPTER. Short-Run Cost. Total cost (TC) is the cost of all productive resources used by a firm. Total fixed cost (TFC) is the cost of all the firm’s fixed inputs. Total variable cost (TVC) is the cost of all the firm’s variable inputs.

E N D
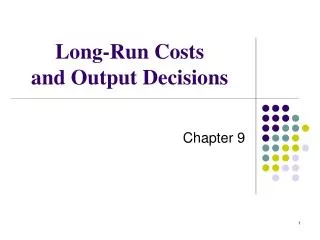
8 Short-run costs and output decisions CHAPTER
Short-Run Cost • Total cost (TC) is the cost of all productive resources used by a firm. • Total fixed cost (TFC) is the cost of all the firm’s fixed inputs. • Total variable cost (TVC) is the cost of all the firm’s variable inputs. • Total cost (TC) is the cost of all productive resources used by a firm. • TC = TFC + TVC
Total Cost Curves • Total Total • fixed variable Total • cost cost cost • Labor Output (TFC) (TVC) (TC) • (workers (sweaters • per day) per day) (dollars per day) • a 0 0 • b 1 4 • c 2 10 • d 3 13 • e 4 15 • f 5 16
Total Cost Curves • Total Total • fixed variable Total • cost cost cost • Labor Output (TFC) (TVC) (TC) • (workers (sweaters • per day) per day) (dollars per day) • a 0 0 25 • b 1 4 25 • c 2 10 25 • d 3 13 25 • e 4 15 25 • f 5 16 25
Total Cost Curves Total Total fixed variable Total cost cost cost Labor Output (TFC) (TVC) (TC) (workers (sweaters per day) per day) (dollars per day) a 0 0 25 0 b 1 4 25 25 c 2 10 25 50 d 3 13 25 75 e 4 15 25 100 f 5 16 25 125
Total Cost Curves • Total Total • fixed variable Total • cost cost cost • Labor Output (TFC) (TVC) (TC) • (workers (sweaters • per day) per day) (dollars per day) • a 0 0 25 0 25 • b 1 4 25 25 50 • c 2 10 25 50 75 • d 3 13 25 75 100 • e 4 15 25 100 125 • f 5 16 25 125 150
TC TVC TFC Total Cost Curves • TCC TC = TFC + TVC 150 Cost (dollars per day) 100 50 0 5 10 15 Output (sweaters per day)
Marginal Cost • Marginal cost is the increase in total cost that results from a one-unit increase in output. • It equals the increase in total cost divided by the increase in output. • Marginal costs decrease at low outputs because of the gains from specialization, but it eventually increases due to the law of diminishing returns.
Average Cost • Average fixed cost (AFC) is total fixed cost per unit of output. • Average variable cost (AVC) is total variable cost per unit of output. • Average total cost (ATC) is total cost per unit of output.
TC TFC TVC = + Q Q Q Average Cost • AC TC = TFC + TVC OR ATC = AFC + AVC
MC ATC AVC AFC Marginal Cost and Average Costs ATC = AFC + AVC 15 • MC Cost (dollars per sweater) 10 5 0 5 10 15
Economic Profit and Revenue • Total revenueis the value of a firm’s sales. • Total revenue = P Q • Marginal revenue(MR) • Change in total revenue resulting from a one-unit increase in quantity sold. • Average revenue(AR) • Total revenue divided by the quantity sold—revenue per unit sold. • In perfect competition, Price = MR = AR
TC Economic loss Economic profit = TR - TC Economic loss Total Revenue, Total Cost, and Economic Profit • TR, TC TR 300 Total revenue & total cost (dollars per day) 225 183 100 0 4 9 12 Quantity (sweaters per day)
Economic profit Economic loss Profit maximizing quantity Total Revenue, Total Cost, and Economic Profit • EP Economic profit/loss 42 Profit/loss (dollars per day) 20 0 Quantity (sweaters per day) 4 9 12 -20 Profit/ loss -40
Marginal Analysis • If MR > MC, the extra revenue from selling one more unit exceeds the extra cost. • The firm should increase output to increase profit. • If MR < MC, the extra revenue from selling one more unit is less than the extra cost. • The firm should decrease output to increase profit. • If MR = MC economic profit is maximized
Profit- maximization point MC Loss from 10th sweater MR Profit from 9th sweater Profit-Maximizing Output • MA 30 25 Marginal revenue & marginal cost (dollars per day) 20 10 0 8 9 10 Quantity (sweaters per day)
MC = S MR2 MR1 Shutdown point AVC s MR0 A Firm’s Supply Curve • SC 31 Marginal revenue & marginal cost (dollars per day) 25 17 0 7 9 10 Quantity (sweaters per day)
S s A Firm’s Supply Curve • SC 31 Marginal revenue & marginal cost (dollars per day) 25 17 0 7 9 10
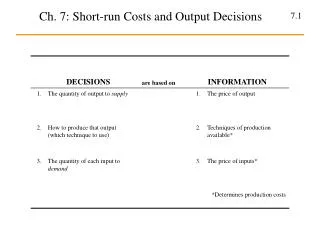
The Firm’s Decisions in Perfect Competition • In the short-run, the firm must decide: • Whether to produce or to shut down. • If the decision is to produce, what quantity to produce.
Break-even point AR = MR Three Possible Profit Outcomes in the Short-Run • NP Normal profit 30.00 MC ATC Price (dollars per chip) 25.00 20.00 15.00 0 8 10 Quantity (millions of chips per year)
AR = MR Economic Profit Three Possible Profit Outcomes in the Short-Run • EP Economic profit 30.00 MC ATC Price (dollars per chip) 25.00 20.33 15.00 0 9 10 Quantity (millions of chips per year)
Economic loss AR = MR Three Possible Profit Outcomes in the Short-Run • EL Economic loss 30.00 MC ATC 25.00 20.14 17.00 0 7 10 Quantity (millions of chips per year)